
|
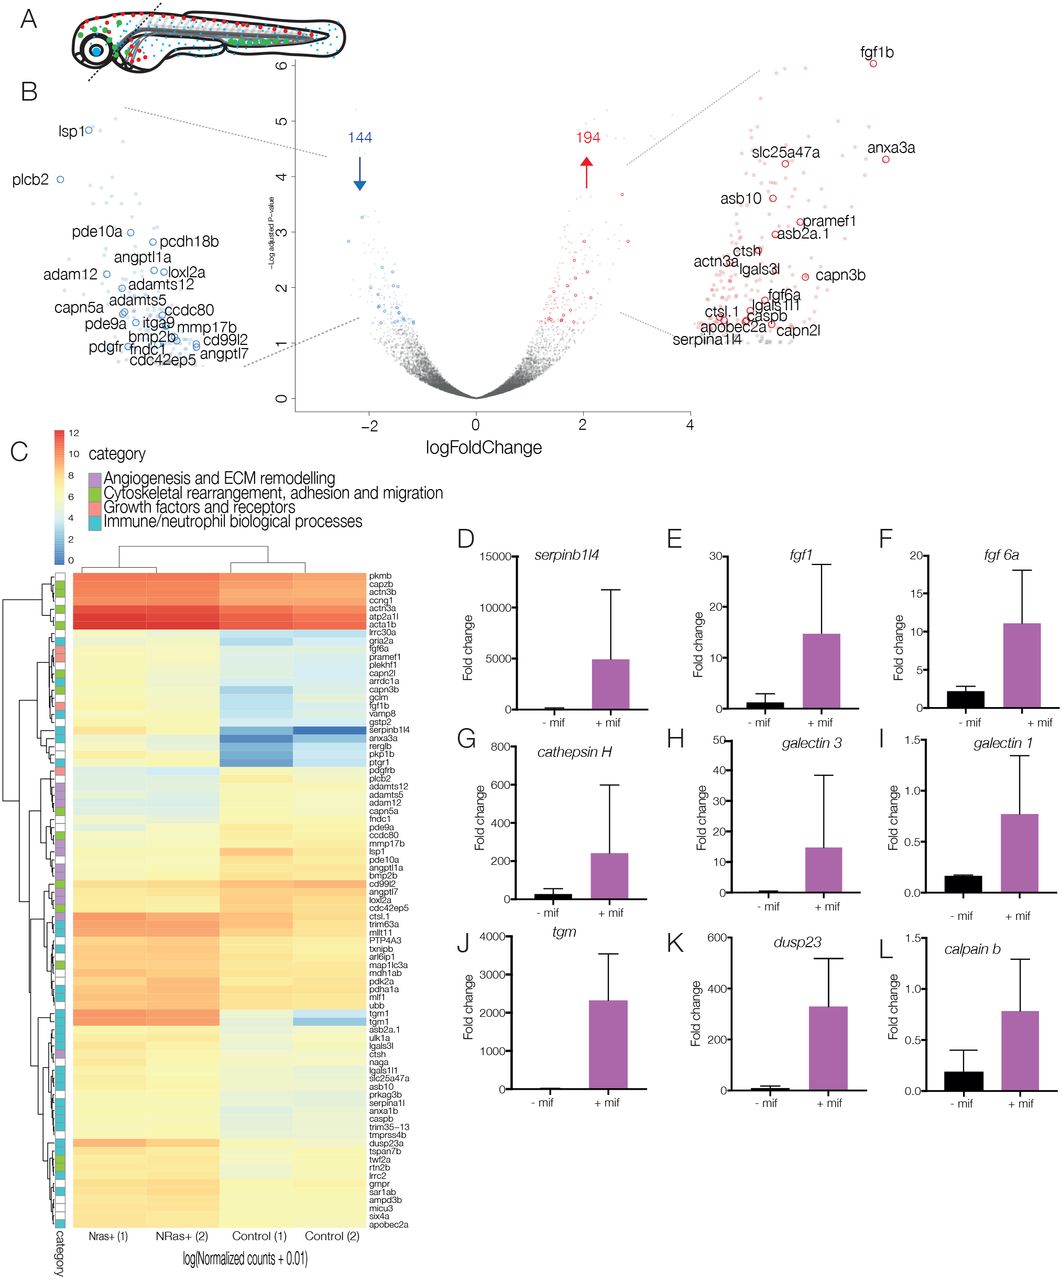
Fig. 5
Analysis of technical replicates to obtain differentially expressed genes. (A) Schematic of dissection of 5-dpf larvae for nuclear profiling of neutrophils in the presence or absence of NRasQ61K-transformed cranial melanocytes. Cranial regions are dissected away from the trunk to eliminate neutrophils from the anterior yolk sac and ICM, enriching for responding neutrophils. (B) Volcano plot of differential expression analysis of activated NRasQ61K and control embryos shows the relationship between P-value and log fold change (red, upregulated; blue, downregulated) shows 194 upregulated genes (red) and 144 downregulated genes (blue) in cranial neutrophils. (C) Heat map shows the log10 [normalised counts (NMCT) +0.01] of selected differentially expressed transcripts (adjusted P-value <0.05). Red, high expression; yellow, medium expression; blue, low expression. Selected differentially expressed transcripts were further classified into subcategories of ‘angiogenesis and ECM remodelling’ (purple), ‘cytoskeletal rearrangement, adhesion and migration’ (green), ‘growth factors and receptors’ (pink) and ‘immune/neutrophil biological processes’ (turquoise). (D-L) Bar graphs represent mRNA levels of upregulated transcripts in controls vs NRasQ61K-activated embryos as measured by qPCR in 2-3 replicate experiments. serpinb1l4 (D), fgf1 (E), fgf6 (F), cathepsin H (G), galectin 3 (H), galectin 1 (I), tgm (J), dusp23 (K) and calpain b (L).