
Image
|
Figure Caption
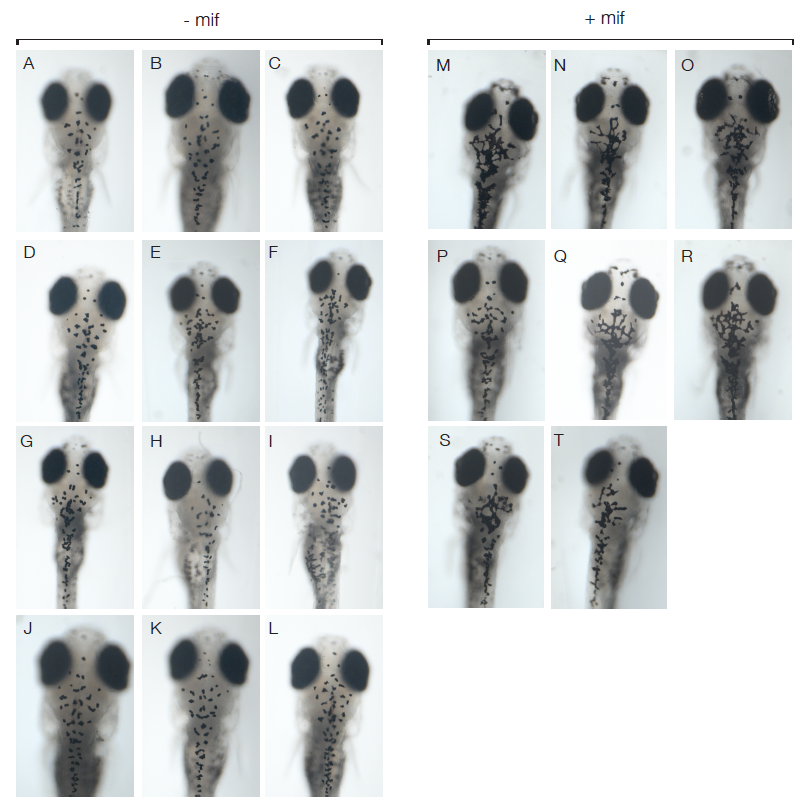
Fig. S3
Comparison of melanocyte morphology in Tg(kita:LexPRCerulean; LexOP:mCherry-NRas)ox12 in oncogene activated (+mif) 12 dpf larvae versus controls (-mif). (A-T) Dorsal views of the head of 12 dpf larvae without (AL) and with mifepristone-dependent mCherry-NRasQ61K activation (red) in Tg(kita:LexPR-Cerulean;LexOP:mCherry-NRas)ox12 (M-T).
Acknowledgments
This image is the copyrighted work of the attributed author or publisher, and
ZFIN has permission only to display this image to its users.
Additional permissions should be obtained from the applicable author or publisher of the image.
Full text @ Dis. Model. Mech.