
- Title
-
Calcium Signals Act Through Histone Deacetylase to Mediate Pronephric Kidney Morphogenesis
- Authors
- Rothschild, S.C., Lee, H.J., Ingram, S.R., Mohammadi, D.K., Walsh, G.S., Tombes, R.M.
- Source
- Full text @ Dev. Dyn.
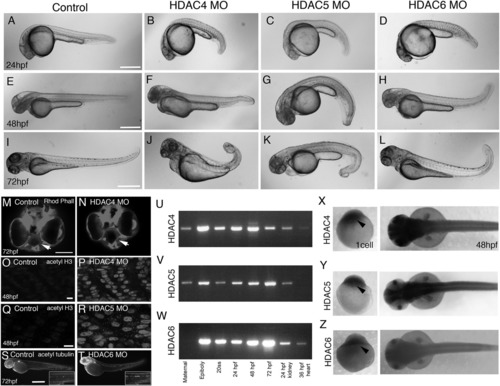
Phenotype of class II HDAC morphants. Gross morphology was assessed at 24 hpf, 48 hpf, and 72 hpf in embryos injected with 2 ng control, 2 ng HDAC4, 2ng HDAC5, or 8 ng HDAC6 MO. Scale bar = 500 μm. Normal orofacial morphology in control embryos (M, arrow) is lost in HDAC4 morphants, where mouth defects and partial clefts are visible (N, arrow) at 72 hpf. Scale bar = 100 μm. Acetylated histone H3 was analyzed at 48 hpf in control embryos (O,Q), 2‐ng HDAC4 MO (P), or 2‐ng HDAC5 MO (R) embryos. Scale bar = 5 μm. Acetylated α‐tubulin was analyzed in control (S) and 8‐ng HDAC6 MO (T) embryos. Scale bar = 500 μm. Semiquantitative reverse transcription‐polymerase chain reaction assessed the expression of HDAC4, HDAC5, and HDAC6 during development (U–W). Expression of hdac4 (X), hdac5 (Y), and hdac6 (Z) was also assessed using whole‐mount in situ hybridization at the one‐cell stage (arrowhead) and at 48 hpf. EXPRESSION / LABELING:
PHENOTYPE:
|
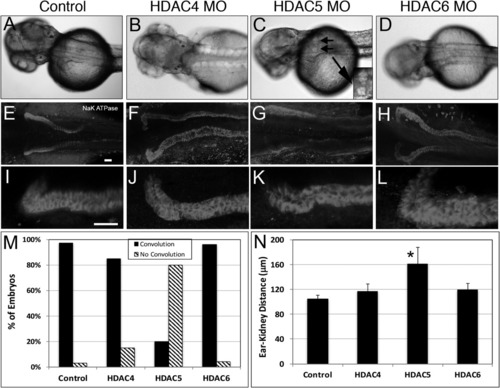
Kidney cysts form in hdac5 morphants. A–D: Dorsal images of embryos injected with 2 ng control, 2 ng HDAC4, 2 ng HDAC5, or 8 ng HDAC6 MO. Cysts were visible in hdac5 morphants (small arrows and inset, magnified view) at 48 hpf. Morphant embryos at 72 hpf were immunostained for α1 Na+K+ ATPase and imaged at low magnification (E–H) and high magnification (I–L). Scale bar = 100 μm. Anterior migration (convolution) is blocked in hdac5 morphants as summarized across the population by image analysis (M) and by the increase in distance between the anterior kidney and posterior ear (N). n = 40–70 embryos per experiment. *P < 0.005. EXPRESSION / LABELING:
PHENOTYPE:
|
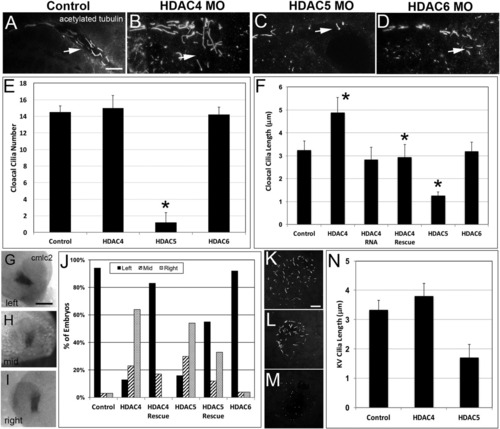
HDACs have opposing effects on primary cilia. A–D: Lateral views of 72‐hpf embryos immunostained for acetylated tubulin (green) reveal cilia at the junction of a pronephric duct with the cloaca. Scale bar = 5 μm. Cloacal cilia number and length were assessed at 72 hpf (E,F). n = 15–30 embryos. *P < 0.005 in comparison to controls. Cardiac asymmetry was analyzed by cmlc2 expression at 24 hpf (G–I) and plotted as a percentage of embryos (J). n = 20–38 embryos. Primary cilia length in the KV at the 12‐somite stage (K–M) is averaged (N). n = 40–60 cilia. Scale bar = 5 μm. *P < 0.005. EXPRESSION / LABELING:
PHENOTYPE:
|
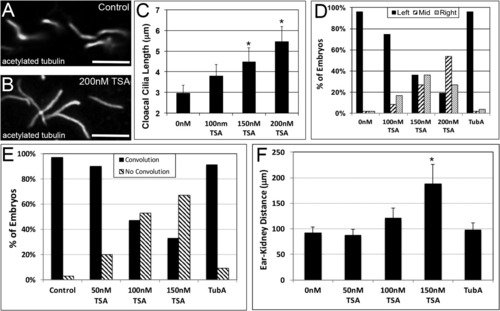
HDAC inhibitors phenocopy hdac morphants. Embryos were continuously treated starting at the cleavage stage with 0–200 nM trichostatin A or 10 μM tubastatin A. Cloacal cilia were imaged at 72 hpf (A,B) and averaged (C). Scale bar = 5 μm. n = 15–30 embryos. Cardiac asymmetry was assessed at 30 hpf (D). n = 30–40 embryos. Anterior kidney convolution (E) and kidney ear distance (F) were determined at 72 hpf. n = 15–26 embryos. *P < 0.005. PHENOTYPE:
|
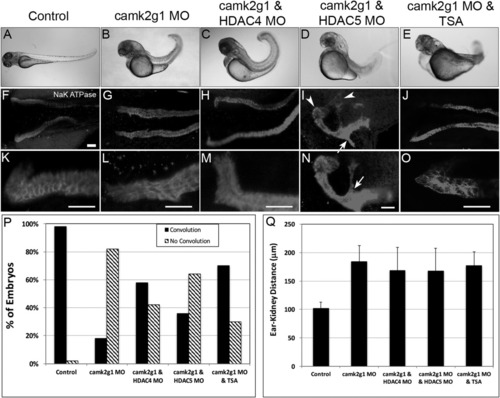
CaMK‐II and HDACs act in the same molecular pathway leading to anterior kidney development. Embryos injected with the camk2g1 MO (1 ng), hdac 4 MO (2 ng), hdac5 MO (2 ng), camk2g1 and hdac MOs together, or the camk2g1 MO followed by bud‐stage trichostatin A treatment were imaged at 72 hpf from lateral perspectives using DIC optics (A–E) or dorsal perspectives using immunofluorescence of α1 Na+/K+ATPase (F–O). Scale bars = 100 μm. Arrowheads in I and N indicate adventitious lumens, and arrows indicate branched ducts. Convolution at 72 hpf (P) and pronephric migration (Q) as assessed by posterior ear‐anterior kidney distance in μm at 72 hpf. n = 30–41 embryos. PHENOTYPE:
|
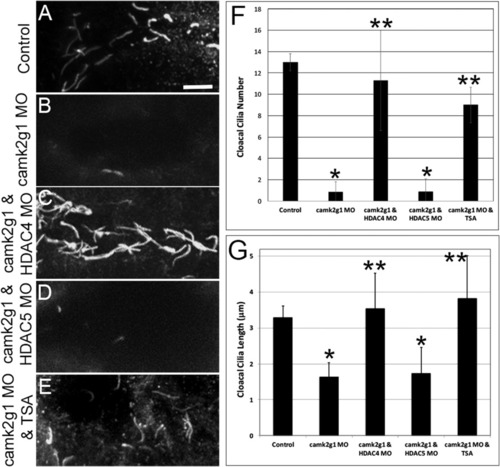
Embryos injected with the camk2g1 MO (CaMKII; 2 ng), hdac 4 MO (2 ng), hdac5 MO (2 ng), camk2g1 and hdac MOs together, or the camk2g1 MO followed by bud‐stage trichostatin A treatment were imaged at 72 hpf after immunolabeling with acetylated tubulin (A–E, green). Scale bar = 5 μm. Cilia number and length were assessed at 72 hpf (F,G). *P < 0.005 compared to control embryos. **P < 0.005 compared to camk2g1 morphants, demonstrating a rescue of the morphant cilia defect. n = 25–62 cilia. PHENOTYPE:
|
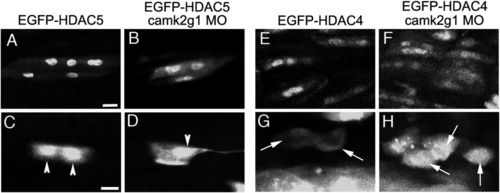
HDAC4 subcellular localization is dependent on CaMK‐II. Embryos injected with EGFP‐HDAC5 (30 ng/μl) alone (A,C), EGFP HDAC5 and camk2g1 MO (1 ng) (B,D), EGFP‐HDAC4 (30 ng/μl) alone (E,G), and EGFP‐HDAC4 and camk2g1 MO (1ng) (F,H) were analyzed for subcellular localization in muscle cells (A,B,E,F) and kidney cells (C,D,G,H) at 24–48 hpf. n = 15–20 embryos. Scale bar = 5 μm. |