
Image
|
Figure Caption
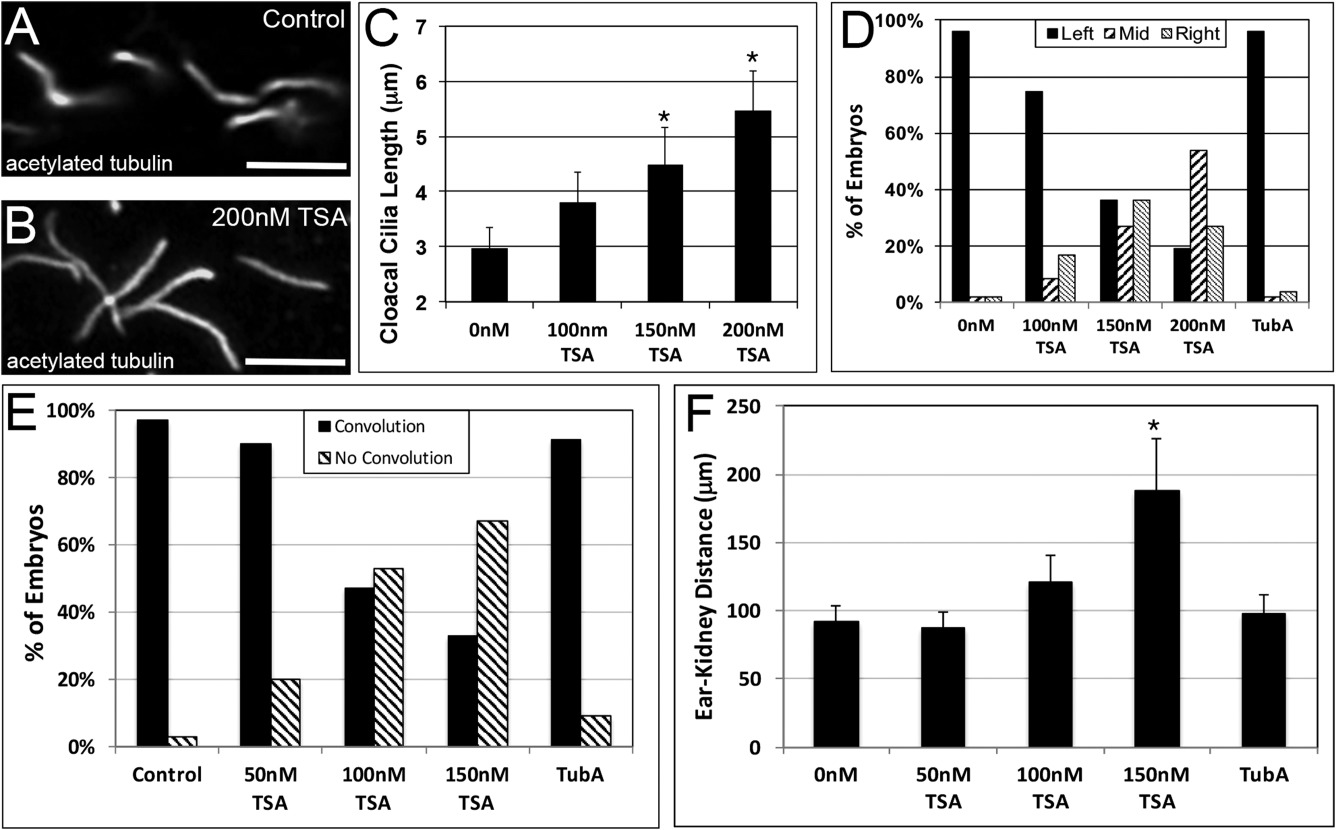
Fig. 4
HDAC inhibitors phenocopy hdac morphants. Embryos were continuously treated starting at the cleavage stage with 0–200 nM trichostatin A or 10 μM tubastatin A. Cloacal cilia were imaged at 72 hpf (A,B) and averaged (C). Scale bar = 5 μm. n = 15–30 embryos. Cardiac asymmetry was assessed at 30 hpf (D). n = 30–40 embryos. Anterior kidney convolution (E) and kidney ear distance (F) were determined at 72 hpf. n = 15–26 embryos. *P < 0.005.
Figure Data
Acknowledgments
This image is the copyrighted work of the attributed author or publisher, and
ZFIN has permission only to display this image to its users.
Additional permissions should be obtained from the applicable author or publisher of the image.
Full text @ Dev. Dyn.