
- Title
-
A synaptic mechanism for temporal filtering of visual signals
- Authors
- Baden, T., Nikolaev, A., Esposti, F., Dreosti, E., Odermatt, B., Lagnado, L.
- Source
- Full text @ PLoS Biol.
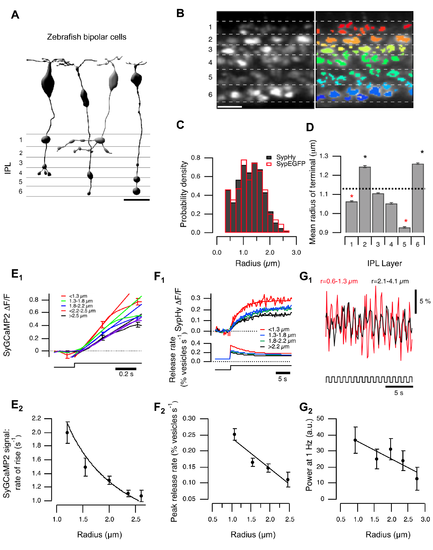
Variations in terminal size, calcium signals, and vesicle release. (A) BCs transmit through multiple terminals. Left: published examples of zebrafish cone BCs [64] illustrate the range of presynaptic terminal sizes. Scalebar = 10 µm. (B) BC terminals in the IPL of a zebrafish (10 dpf) expressing sypHy under control of the ribeye promoter. Left: Raw image showing six strata of the IPL. Right: Overlay of ROIs defining terminals. Scale bar = 10 µm. (C) The distribution of the effective terminal radii. Black bars show estimates obtained in fish expressing sypHy (n = 5,061 terminals from seven fish), and the red bars shows the distribution measured in fish expressing synaptophysin-EGFP (n = 421 terminals from one fish). Distribution of sizes calculated with SyGCaMP2 is shown in Figure S1H. (D) Variations in average radius of terminals in each stratum. The average radius over the whole IPL was 1.13±0.40 µm (dashed line). Stars mark strata in which the average radius was significantly greater or smaller (p<0.001, Wilcoxon rank-sum test, n varies between 560 and 930 terminals). Similar distributions calculated for individual layers are shown in Figure S1I. (E) Relation between terminal size and calcium signals. (E1) SyGCaMP2 signals in response to a step of light (λ = 590 nm; for details see methods) in ON terminals, averaged over groups of the effective radius shown (n = 143, 347, 286, 114, and 36, respectively). Straight lines fitted over the initial phase. Significant difference between groups 1, 3, and 5 (Student's t test: p(1–3) = 0.004; p(3–5) = 0.005; p(1–5)<0.001). (E2) The rate of rise of the SyGCaMP2 signal varies as the inverse of the radius, as shown by the fitted curve (n = 926 from five fish). Spearman correlation coefficient = −1, critical value (p = 0.05) = 0.85. (F) Relation between terminal size and peak rate of vesicle release. (F1) SypHy signals in response to a step of light in ON terminals, averaged over groups of the effective radius shown (n = 117, 176, 113, and 33 terminals from five fish). The lower panel shows the conversion into relative release rates, as described [14]. (F2) The initial rate of vesicle release as a function of radius (total n = 438 terminals from five fish). The points fall on a line. Spearman correlation = −1, critical value (p = 0.05) = 0.9. (G) terminal size and modulation of presynaptic calcium. (G1) SyGCaMP2 signal driven by modulation of light intensity at 1 Hz (100% contrast, square wave). Red trace averaged over OFF contrast responding terminals with r = 0.6–1.3 µm; black trace averaged over OFF contrast responding terminals with r = 2.1–4.1 µm. (G2) relative power of the signal at 1 Hz as a function of radius (n = 98, 89, 68, 37, and 9 terminals from four fish). Points were fitted with a line. Responses to light decrements are shown in Figure S1G. |
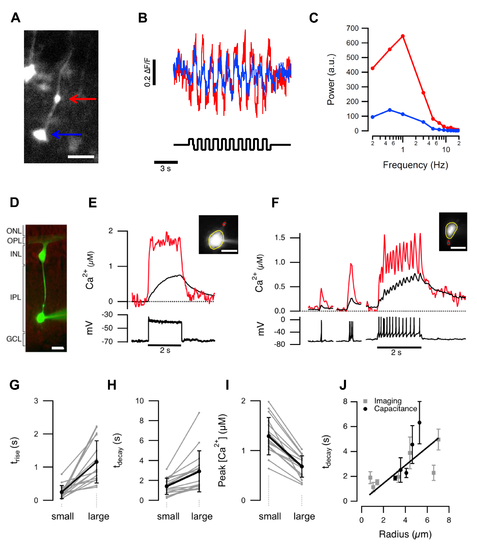
Different calcium signals in small and large terminals of the same cell. (A) A BC expressing GCaMP5. Large and small terminals are indicated by the blue and red arrows. Scalebar 10 µm. (B) Responses of the terminals in (A) to a stimulus modulated at 1 Hz. (C) Power spectrum of the responses from large and small terminals calculated for different stimulus frequencies. (D) Mixed BC filled with OGB-5N in a slice of goldfish retina. Scale bar 10 µm. (E) Spatially averaged Ca2+ signals in the small (red) and large (black) terminal during a 2 s depolarizing current step (10 pA). This BC did not generate spikes. (F) A comparison of Ca2+ signals in the small and large terminal of a “spiking” BC. Each spike caused a calcium transient that was larger and faster in the smaller terminal. (G–I) Time constants of the calcium signal rise (trise), decay (tdecay), and peak amplitude, evaluated in 16 pairs of small and large terminals. For small and large, τrise = 0.25±0.20 and 1.16±0.64 s; τdecay = 1.42±0.82 and 2.91±2.05 s; amplitude = 1.29±0.38 and 0.68±0.21 µM. All these parameters were significantly different in small and large terminals (p<0.001; Wilcoxon ranked sum, n = 16 cells from nine adult retinae). The average radii of the small and large terminals were 1.1±0.3 and 5.2±1.2 µm, respectively. (J) Time constants of calcium decay were directly proportional to terminal radius determined using imaging (grey, n = 32 terminals) or capacitance measurements (black, n = 20 terminals). The linear fit was constrained to go through the origin. Error bars show 1 standard deviation (SD). |
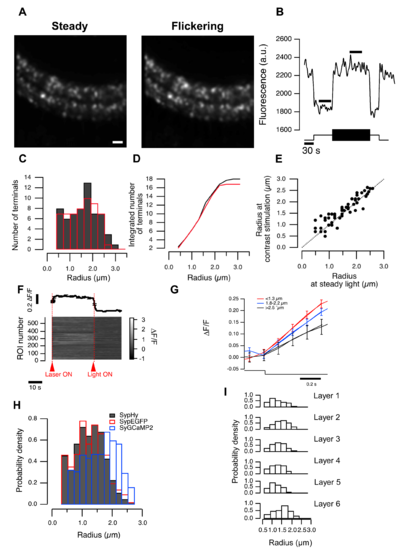
Size estimation does not depend on the stimulus condition (related to Figure 1). (A) Two images of the same field of view: the left obtained from an average of 45 s in the dark, and the right averaged over a 45 s period in which the mean light intensity was in the low photopic range, including 45 s of temporal contrast applied at 1 Hz (100% contrast). Scale bar 10 m. (B) OFF terminals have brightest fluorescence during contrast presentation and dimmest fluorescence when exposed to steady light. Black bars show parts of the movie used for image averaging. (C) Distribution of terminal sizes estimated from averages shown in (A) (at steady light, red and temporal contrast, black). (D) Cumulative distributions, calculated from (C). (E) Terminal sizes estimated from terminals during steady and flickering light stimulation (c.f. (A)). Each point represents size estimation of an individual terminal. All points are scatted around a line through the origin with slope of 1, suggesting that size estimation is not affected significantly by the terminal activity. (F) Example of n = 589 OFF cells responding to laser and visual stimulation (arrows). Top: average of all responses, bottom: individual responses. Error in (standard error of the mean) SEM. (G) Responses of OFF terminals of different sizes to light decrement. Bins are the same as in Figure 1E. (I) Distributions of terminal radii calculatEed from individual layers. |
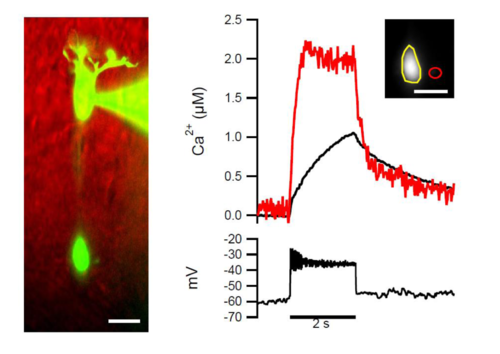
Recording “mixed” BCs from the soma (related to Figure 2). To ensure that the size dependence of current evoked calcium signals measured in different terminals belonging to the same “mixed” BC was not dependent on the position of the micropipette, we repeated experiments shown in Figure 2D–2F but this time targeted the soma of individual cells rather than the large terminal. The size dependence persisted in somatal recordings. One example of n = 4 is shown (c.f. Figure 2D–2F). |