
Fig. S1
- ID
- ZDB-FIG-171227-26
- Publication
- Baden et al., 2014 - A synaptic mechanism for temporal filtering of visual signals
- Other Figures
- All Figure Page
- Back to All Figure Page
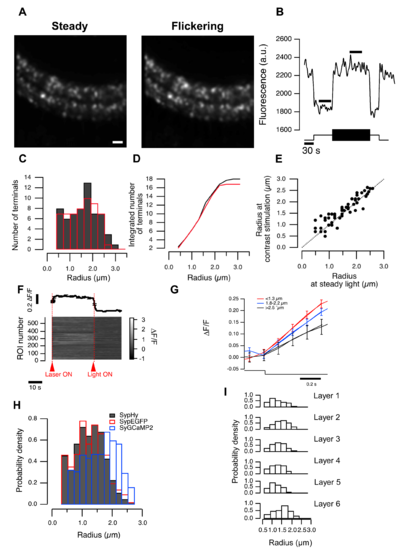
Size estimation does not depend on the stimulus condition (related to Figure 1). (A) Two images of the same field of view: the left obtained from an average of 45 s in the dark, and the right averaged over a 45 s period in which the mean light intensity was in the low photopic range, including 45 s of temporal contrast applied at 1 Hz (100% contrast). Scale bar 10 m. (B) OFF terminals have brightest fluorescence during contrast presentation and dimmest fluorescence when exposed to steady light. Black bars show parts of the movie used for image averaging. (C) Distribution of terminal sizes estimated from averages shown in (A) (at steady light, red and temporal contrast, black). (D) Cumulative distributions, calculated from (C). (E) Terminal sizes estimated from terminals during steady and flickering light stimulation (c.f. (A)). Each point represents size estimation of an individual terminal. All points are scatted around a line through the origin with slope of 1, suggesting that size estimation is not affected significantly by the terminal activity. (F) Example of n = 589 OFF cells responding to laser and visual stimulation (arrows). Top: average of all responses, bottom: individual responses. Error in (standard error of the mean) SEM. (G) Responses of OFF terminals of different sizes to light decrement. Bins are the same as in Figure 1E. (I) Distributions of terminal radii calculatEed from individual layers. |