
Fig. 1
- ID
- ZDB-FIG-171227-24
- Publication
- Baden et al., 2014 - A synaptic mechanism for temporal filtering of visual signals
- Other Figures
- All Figure Page
- Back to All Figure Page
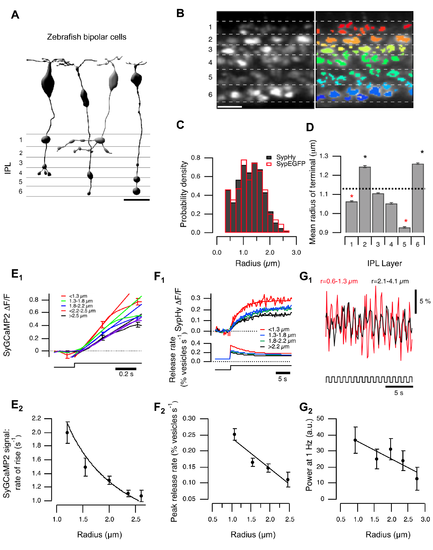
Variations in terminal size, calcium signals, and vesicle release. (A) BCs transmit through multiple terminals. Left: published examples of zebrafish cone BCs [64] illustrate the range of presynaptic terminal sizes. Scalebar = 10 µm. (B) BC terminals in the IPL of a zebrafish (10 dpf) expressing sypHy under control of the ribeye promoter. Left: Raw image showing six strata of the IPL. Right: Overlay of ROIs defining terminals. Scale bar = 10 µm. (C) The distribution of the effective terminal radii. Black bars show estimates obtained in fish expressing sypHy (n = 5,061 terminals from seven fish), and the red bars shows the distribution measured in fish expressing synaptophysin-EGFP (n = 421 terminals from one fish). Distribution of sizes calculated with SyGCaMP2 is shown in Figure S1H. (D) Variations in average radius of terminals in each stratum. The average radius over the whole IPL was 1.13±0.40 µm (dashed line). Stars mark strata in which the average radius was significantly greater or smaller (p<0.001, Wilcoxon rank-sum test, n varies between 560 and 930 terminals). Similar distributions calculated for individual layers are shown in Figure S1I. (E) Relation between terminal size and calcium signals. (E1) SyGCaMP2 signals in response to a step of light (λ = 590 nm; for details see methods) in ON terminals, averaged over groups of the effective radius shown (n = 143, 347, 286, 114, and 36, respectively). Straight lines fitted over the initial phase. Significant difference between groups 1, 3, and 5 (Student's t test: p(1–3) = 0.004; p(3–5) = 0.005; p(1–5)<0.001). (E2) The rate of rise of the SyGCaMP2 signal varies as the inverse of the radius, as shown by the fitted curve (n = 926 from five fish). Spearman correlation coefficient = −1, critical value (p = 0.05) = 0.85. (F) Relation between terminal size and peak rate of vesicle release. (F1) SypHy signals in response to a step of light in ON terminals, averaged over groups of the effective radius shown (n = 117, 176, 113, and 33 terminals from five fish). The lower panel shows the conversion into relative release rates, as described [14]. (F2) The initial rate of vesicle release as a function of radius (total n = 438 terminals from five fish). The points fall on a line. Spearman correlation = −1, critical value (p = 0.05) = 0.9. (G) terminal size and modulation of presynaptic calcium. (G1) SyGCaMP2 signal driven by modulation of light intensity at 1 Hz (100% contrast, square wave). Red trace averaged over OFF contrast responding terminals with r = 0.6–1.3 µm; black trace averaged over OFF contrast responding terminals with r = 2.1–4.1 µm. (G2) relative power of the signal at 1 Hz as a function of radius (n = 98, 89, 68, 37, and 9 terminals from four fish). Points were fitted with a line. Responses to light decrements are shown in Figure S1G. |