
|
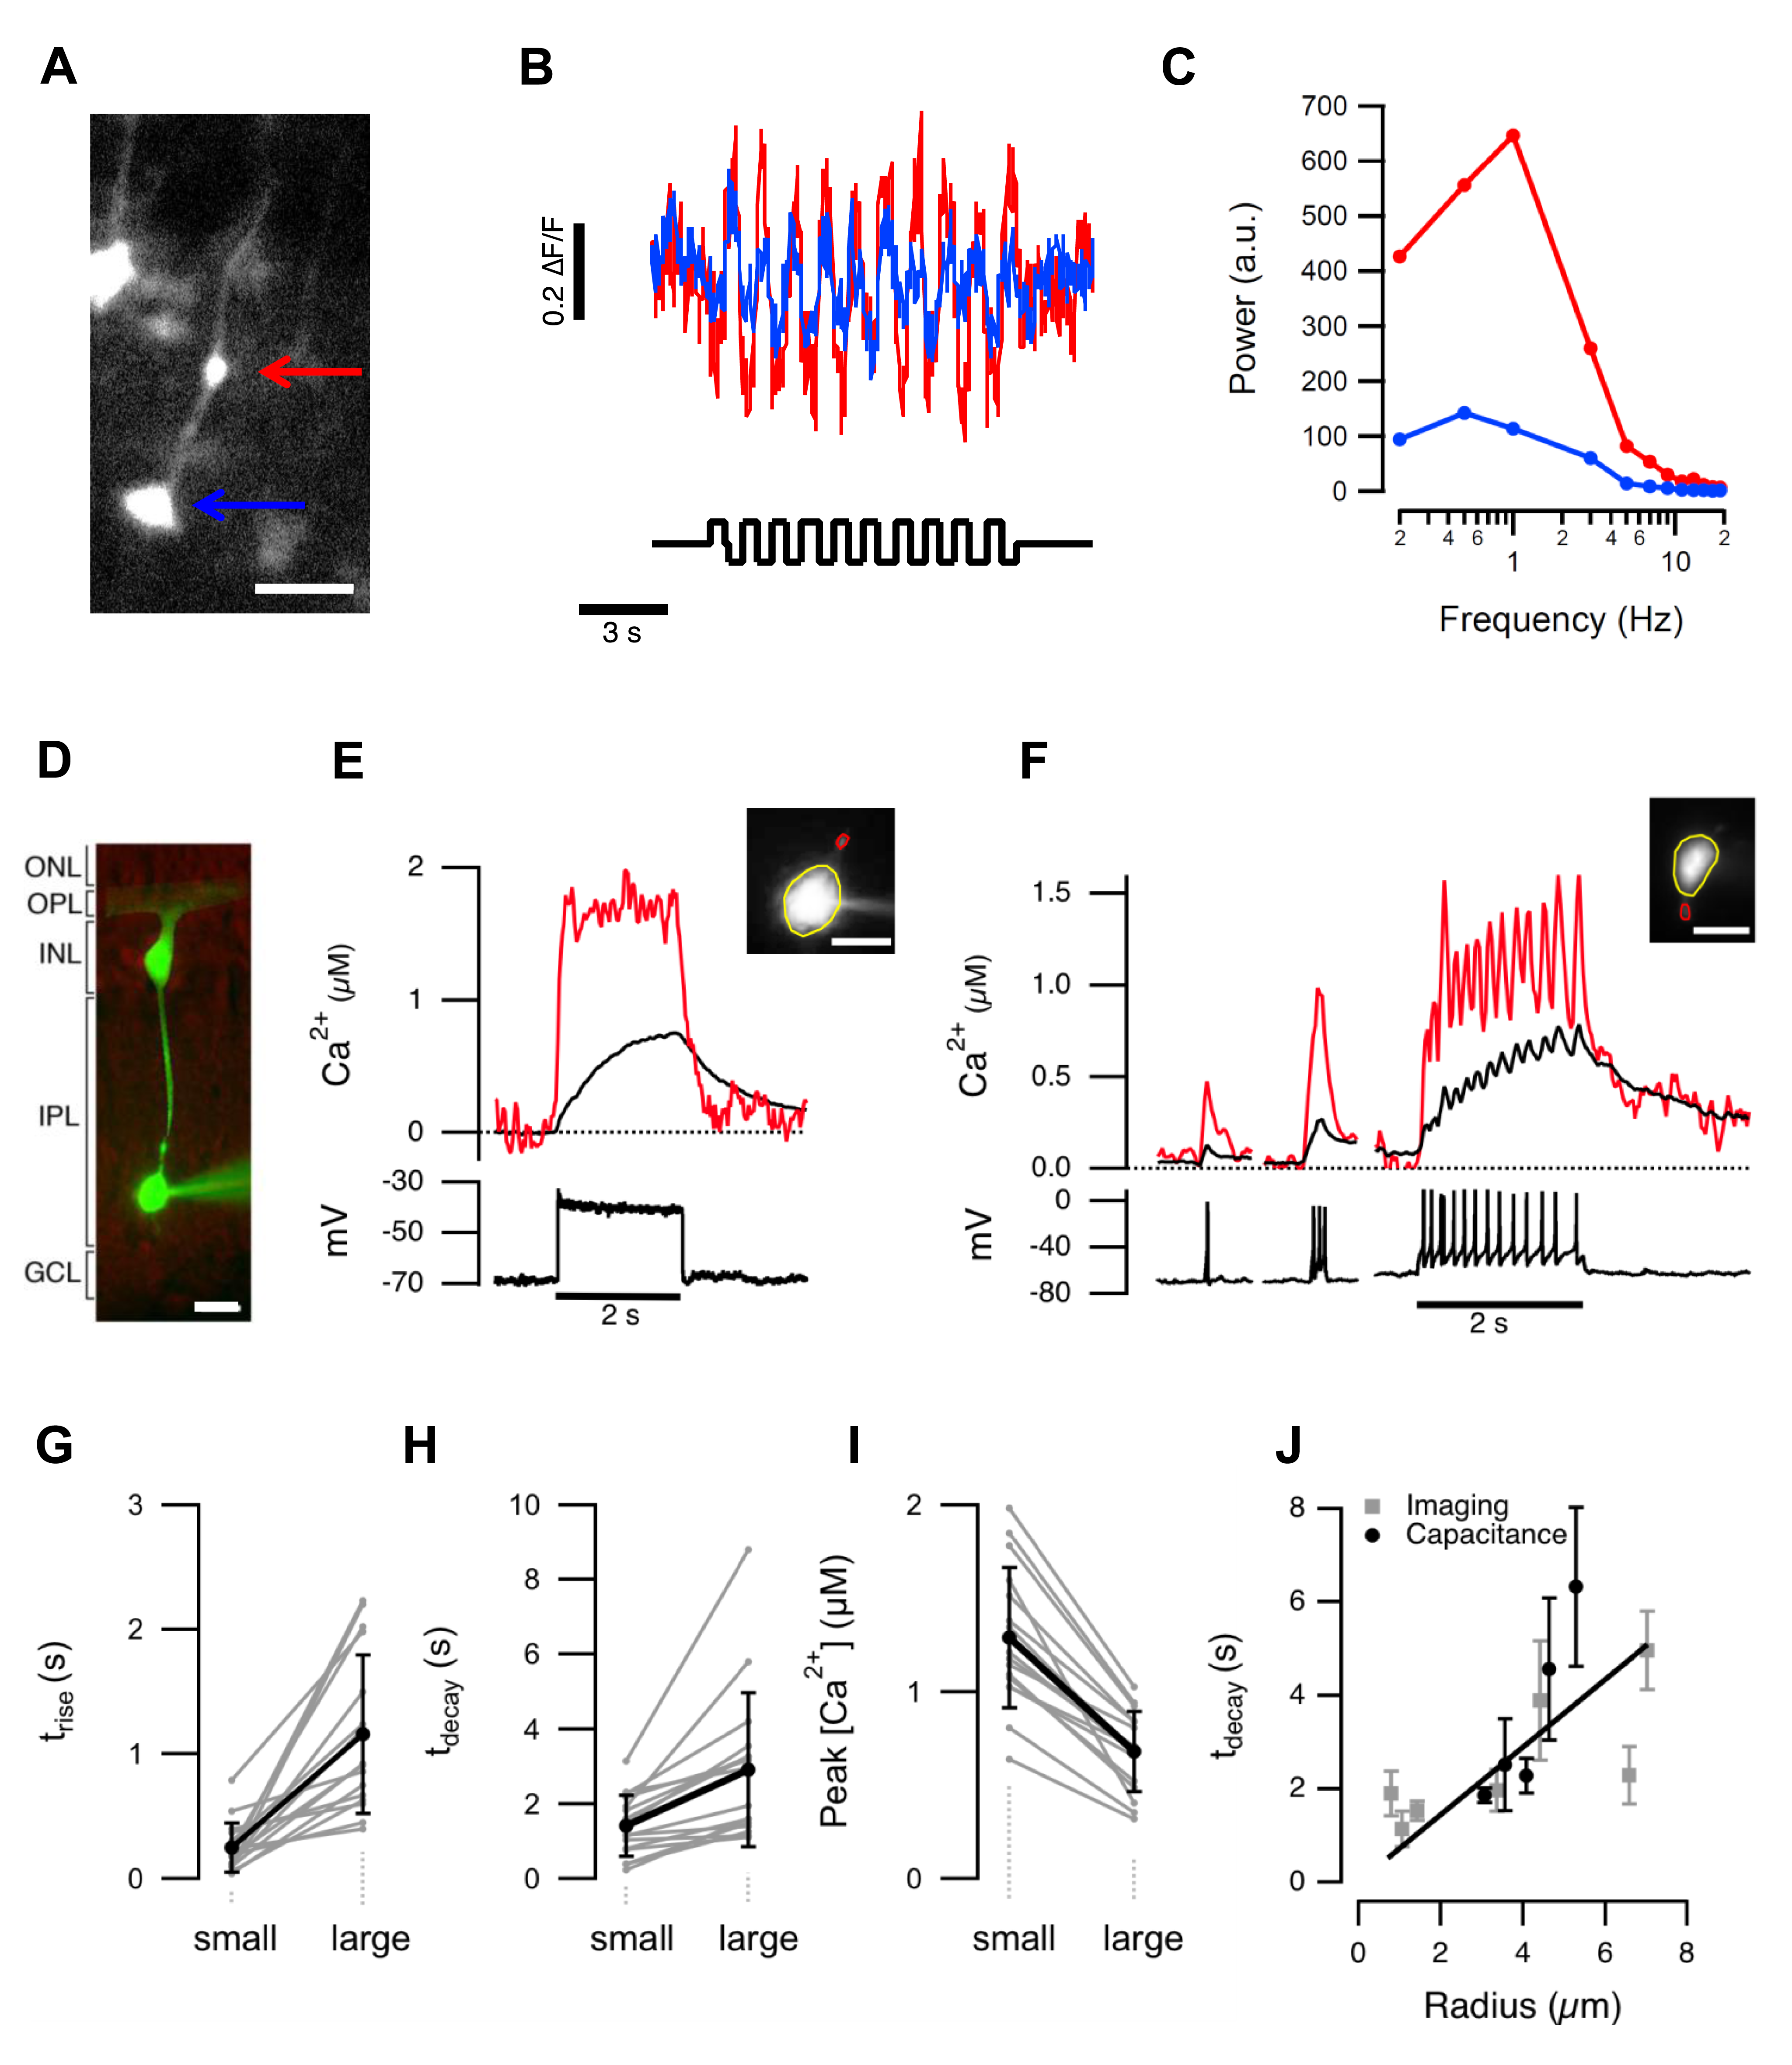
Fig. 3
Different calcium signals in small and large terminals of the same cell.
(A) A BC expressing GCaMP5. Large and small terminals are indicated by the blue and red arrows. Scalebar 10 µm. (B) Responses of the terminals in (A) to a stimulus modulated at 1 Hz. (C) Power spectrum of the responses from large and small terminals calculated for different stimulus frequencies. (D) Mixed BC filled with OGB-5N in a slice of goldfish retina. Scale bar 10 µm. (E) Spatially averaged Ca2+ signals in the small (red) and large (black) terminal during a 2 s depolarizing current step (10 pA). This BC did not generate spikes. (F) A comparison of Ca2+ signals in the small and large terminal of a “spiking” BC. Each spike caused a calcium transient that was larger and faster in the smaller terminal. (G–I) Time constants of the calcium signal rise (trise), decay (tdecay), and peak amplitude, evaluated in 16 pairs of small and large terminals. For small and large, τrise = 0.25±0.20 and 1.16±0.64 s; τdecay = 1.42±0.82 and 2.91±2.05 s; amplitude = 1.29±0.38 and 0.68±0.21 µM. All these parameters were significantly different in small and large terminals (p<0.001; Wilcoxon ranked sum, n = 16 cells from nine adult retinae). The average radii of the small and large terminals were 1.1±0.3 and 5.2±1.2 µm, respectively. (J) Time constants of calcium decay were directly proportional to terminal radius determined using imaging (grey, n = 32 terminals) or capacitance measurements (black, n = 20 terminals). The linear fit was constrained to go through the origin. Error bars show 1 standard deviation (SD).