
- Title
-
Nucleophosmin leukemogenic mutant activates Wnt signaling during zebrafish development
- Authors
- Barbieri, E., Deflorian, G., Pezzimenti, F., Valli, D., Saia, M., Meani, N., Gruszka, A.M., Alcalay, M.
- Source
- Full text @ Oncotarget
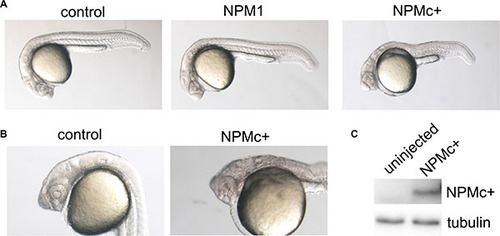
Embryo morphology after NPM1 and NPMc+ expression in zebrafish embryos. (A) Overall view of control (uninjected), NPM1 (90% of injected embryos showing the reported phenotype) and NPMc+ (85% of injected embryos showing the reported phenotype in multiple experiments) expressing embryos at 24 hpf. (B) Head structures in control and NPMc+ expressing embryos at 24 hpf. (C) Western blot analysis of NPMc+ expression levels in zebrafish embryos. |

Analysis of CE movements at gastrulation. Whole mount in situ hybridization for rx3 and pax2a markers of the eye field and telencephalon region (et) and mid-hindbrain boundary (mhb), respectively. All embryos are at 90% epiboly, dorsal view. Distance between rx3 and pax2a expression regions was measured with ImageJ; statistical significance was assessed with a Student’t test. (A) Schematic representation of areas of markers expression. (B) Representative example of uninjected control. Embryos injected with: (C) NPMc+ mRNA; (D) dkk1b mRNA; (E) NPMc+ and dkk1b mRNAs. (F) Graphic representation of the distance between rx3 and pax2a expression regions for each measured sample (20 embryos were analyzed for each condition). EXPRESSION / LABELING:
|
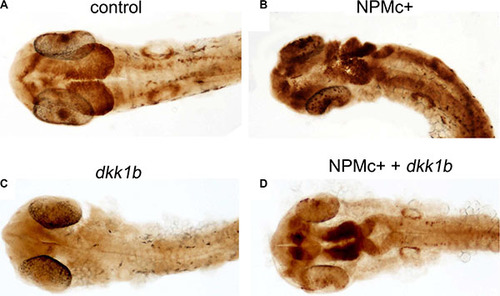
Canonical Wnt activation in 28 hpf embryos. DAB-staining for GFP expression in TOP:GFP embryos at 28 hpf. Embryos are shown in dorsal view. (A) uninjected control (32/32). Embryos injected with: (B) NPMc+ mRNA (27/28); (C) dkk1b mRNA (32/32); (D) NPMc+ and dkk1b mRNAs (16/22). EXPRESSION / LABELING:
|
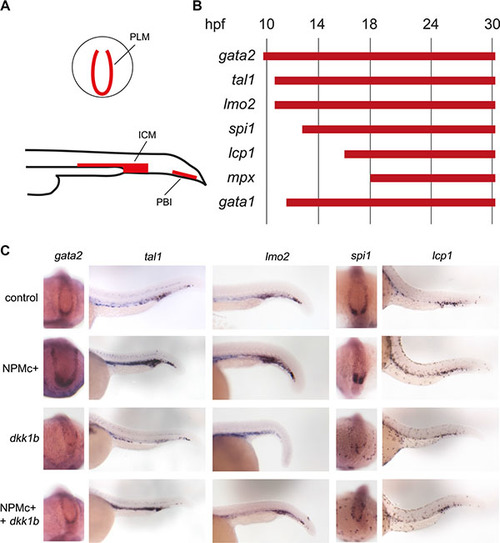
Expression of hematopoietic markers during early zebrafish hematopoiesis. (A) Schematic representation of primitive hematopoietic organs in zebrafish embryos as seen in posterior (top) and lateral (bottom) views showing PLM (posterior lateral mesoderm), ICM (intermediate cell mass) and PBI (posterior blood island). (B) Timeline of expression of hematopoietic markers expressed in the posterior hematopoietic region of zebrafish embryos during primitive hematopoiesis. (C) Whole mount in situ hybridization for gata2 (15 somites embryos, dorsal and posterior view. The phenotypes were encountered in a number of embryos as detailed for each marker hereafter. Control: 41/41, NPMc+: 29/32, dkk1b: 31/31, NPMc+ and dkk1b: 20/27), tal1 and lmo2 (24 hpf embryos, lateral view. For tal1: control: 51/52, NPMc+: 65/85, dkk1b: 30/43, NPMc+ and dkk1b: 17/34. For lmo2: control: 44/45, NPMc+: 33/34, dkk1b: 27/33, NPMc+ and dkk1b: 24/33), spi1 (15 somites embryos, dorsal and posterior view. Control: 32/32, NPMc+: 21/23, dkk1b: 33/34, NPMc+ and dkk1b: 22/28), lcp1(30 hpf embryos, lateral view. Control: 23/24, NPMc+: 26/28, dkk1b: 25/25, NPMc+ and dkk1b: 30/37). EXPRESSION / LABELING:
|
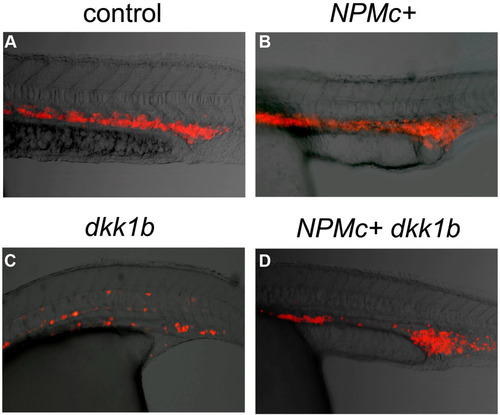
Expression of the erythrocytic marker gata1 in 24 hpf embryos. gata1 expression in gata1:dsRED embryos at 24 hpf, lateral view. (A) control embryo (33/33). Embryos were injected with NPMc+ mRNA (B; 28/31), dkk1b mRNA (C; 36/37) or co-injected with NPMc+ and dkk1b mRNAs (D; 8/35). Embryos were viewed with a Leica SP2 TCS confocal microscope. |