
Fig. 4
|
Fig. 4
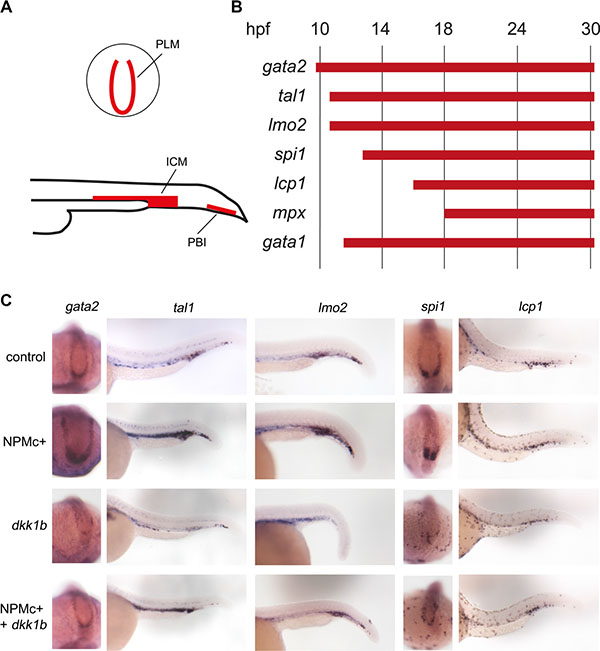
Expression of hematopoietic markers during early zebrafish hematopoiesis. (A) Schematic representation of primitive hematopoietic organs in zebrafish embryos as seen in posterior (top) and lateral (bottom) views showing PLM (posterior lateral mesoderm), ICM (intermediate cell mass) and PBI (posterior blood island). (B) Timeline of expression of hematopoietic markers expressed in the posterior hematopoietic region of zebrafish embryos during primitive hematopoiesis. (C) Whole mount in situ hybridization for gata2 (15 somites embryos, dorsal and posterior view. The phenotypes were encountered in a number of embryos as detailed for each marker hereafter. Control: 41/41, NPMc+: 29/32, dkk1b: 31/31, NPMc+ and dkk1b: 20/27), tal1 and lmo2 (24 hpf embryos, lateral view. For tal1: control: 51/52, NPMc+: 65/85, dkk1b: 30/43, NPMc+ and dkk1b: 17/34. For lmo2: control: 44/45, NPMc+: 33/34, dkk1b: 27/33, NPMc+ and dkk1b: 24/33), spi1 (15 somites embryos, dorsal and posterior view. Control: 32/32, NPMc+: 21/23, dkk1b: 33/34, NPMc+ and dkk1b: 22/28), lcp1(30 hpf embryos, lateral view. Control: 23/24, NPMc+: 26/28, dkk1b: 25/25, NPMc+ and dkk1b: 30/37).