
- Title
-
Autophagy Regulates Cytoplasmic Remodeling During Cell Reprogramming in a Zebrafish Model of Muscle Regeneration
- Authors
- Saera-Vila, A., Kish, P.E., Louie, K.W., Grzegorski, S.J., Klionsky, D.J., Kahana, A.
- Source
- Full text @ Autophagy
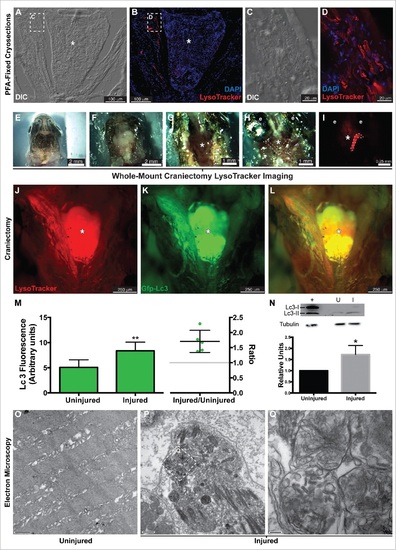
Autophagy in the regenerating EOMs. (A to L) LysoTracker Red was used to label autophagy in the regenerating LR (left side), after staining fish heads were processed for cryosectioning ((A to D). (A, B) Sections containing the regenerating LR were imaged at lower magnification. (C, D) Higher-resolution detail of the boxes in (A)and (B), respectively. ((E)to L) Craniectomy was also used to visualize LysoTracker Red labeling in situ. At 16 hpi, zebrafish heads were mounted in agarose (E), and the top of the skulls was removed (F). Brain was extracted to expose the skull base (*) where the pituitary is located and both LR muscles attach to the bone (G). Then the lateral bones of the skull were removed to allow complete visualization of the LR muscles (H). (I) Fluorescent visualization of H. LysoTracker Red (J) and GFP-Lc3 (K) clearly accumulate and colocalize (L) in the regenerating LR. (M) Fluorescence intensity of GFP signal was therefore higher in the injured muscle; in fact, the ratio of the intensities of injured vs control was higher than 1 in every fish, meaning a net increase of GFP-Lc3 content of the injured muscle (Student t test, **, P < 0.01, n = 5). (N) Western blot of Lc3 showed an increase of Lc3-II in the injured muscle, indicating again autophagy activation (Mann-Whitney test, *, P < 0.05, n = 4). Protein loading was assayed with an anti-Tubg1/tubulin antibody. +, positive control (rat protein); U, uninjured; I, injured. (O to Q) Electron microscopy showed that double-membrane organelles were easily detected in the injured muscle (P, scale bar: 500 nm; Q, scale bar: 100 nm) while virtually undetectable in the control muscle (O, scale bar: 500 nm). Check Figure 30 for a diagram of a craniectomyzed zebrafish head. |

ZFIN is incorporating published figure images and captions as part of an ongoing project. Figures from some publications have not yet been curated, or are not available for display because of copyright restrictions. |
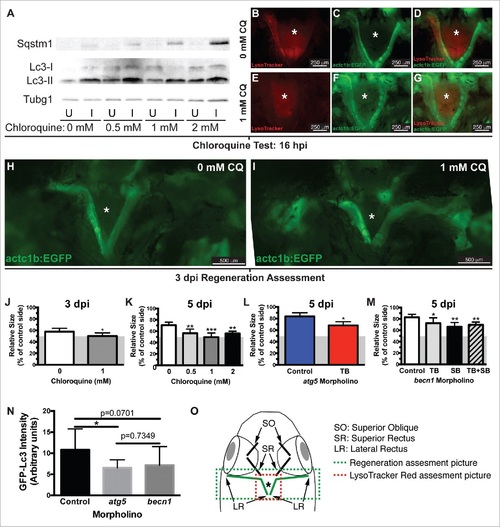
Autophagy is required for EOM regeneration. (A) Western blot of fish treated with increasing CQ concentrations showed a dose-dependent increase of Sqstm1 in the injured muscle and Lc3-II in both injured and uninjured muscles (see Figure S1), indicating real autophagy flux. Protein loading was assayed with an anti-Tubg1 antibody. U, uninjured; I, injured. (B o G) The lack of LysoTracker Red staining in injured LR muscles of transgenic actc1b/α-actin:EGFP zebrafish (to visualize the muscles) using our craniectomy technique confirmed that CQ effectively blocked autophagy. (H to J) Craniectomy of an untreated (H) and CQ-treated fish (I) at 3 dpi; note the difference in length of the injured muscle between both groups (pictures are representative examples of 5 fish per group). (J) Quantification of LR muscle regeneration of fish shown in H and I; values are averages ± SD (Student t test, *, P < 0.05, n = 5). (K) Quantification of LR muscle regeneration at 5 dpi treated with different CQ concentrations; values are averages ± SD (One-way ANOVA, P < 0.0001, n=5; **, P < 0.01; ***, P < 0.001; Newman-Keuls multiple comparisons test). (L) Regeneration of LR muscles injected with control or atg5 translation-blocking (TB) MO was measured at 5 dpi; values are averages ± SD (Student t test, *, P < 0.05, n = 5). (M) Regeneration of LR muscles injected with control or becn1 MOs (translation-blocking, TB; splicing-blocking, SB; combination of both, TB+SB) was measured at 5 dpi; values are averages ± SD (Student t test; *, P < 0.05; **, P < 0.01, n = 5). (J to M) Since myectomy left approximately 50% of the muscle remaining, the measurements are shown for the entire regenerating muscle with a gray box indicating the approximate location of the myectomy site. (N) Fluorescence intensity of LR muscles of GFP-Lc3 fish injected with control, atg5 TB or becn1 TB+SB MOs was measured at 18 hpi; values are averages ± SD (Student t test; *, P < 0.05, n = 8). (O) Diagram of a craniectomized zebrafish head; muscles visualized by this technique are shown, and LR muscles are highlighted in green. Green and red boxes show approximately the picture used for regeneration or LysoTracker Red (or GFP-Lc3) assessment, respectively. * Skull base where the pituitary is located. |
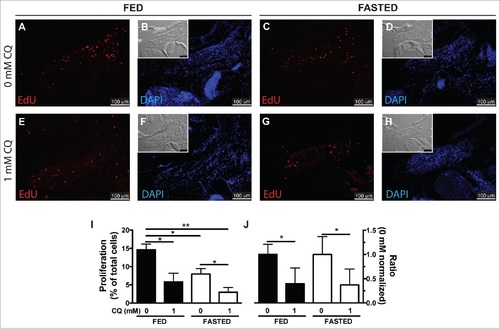
Autophagy as an energy-providing and recycling process. (A to H) Fed and fasted fish were myectomized and treated with or without CQ. Proliferation was visualized at 24 hpi staining for EdU; the inset shows the differential interference contrast image. (I) Quantification of proliferation showed that both fasting and CQ treatment reduced proliferation in the regenerating LR muscle; values are averages ± SEM (Student t test, *, P < 0.05; **, P < 0.01; n = 4). (J) To better illustrate the interaction of feeding condition and CQ treatment, proliferation values were normalized to the 0 mM CQ value of each group showing that CQ treatment reduced proliferation similarly in both fed and fasted fish. Values are averages ± SEM (Student t test; *, P < 0.05, n = 4). PHENOTYPE:
|
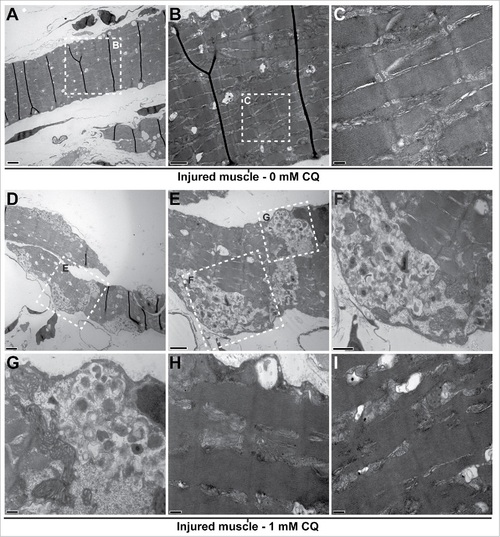
Blocking autophagy affects cytoplasmic organization of the regenerating muscle. Fish were myectomized and treated with or without CQ, 5 d later the regenerating muscle was extracted and imaged by electron microscopy. (A) Electron micrography of regenerating muscles without CQ treatment, scale bar: 2 µm. (B, C) High-magnification images of the boxes in (A)and (B)showing the typical sarcomeric structure; scale bars represent 1 µm and 200 nm, respectively. (D) Overview of the regenerating muscle of treated fish, note the high amount of unresolved autophagosomes, scale bar: 2 µm. (E) View of the box in (D)showing an example of unresolved autophagosomes, scale bar: 1 µm. (F, G) High-magnification views of the boxes in (E)revealed that the autophagosomes were filled with undigested cellular debris; scale bars represent 600 nm and 200 nm, respectively. (H, I) In addition to the unresolved autophagosomes, the analysis of the CQ-treated fish revealed that the regenerating muscle contained a high proportion of disorganized sarcomeres (compare to C); scale bars: 200 nm. This was not found in the injured muscles of untreated fish. PHENOTYPE:
|
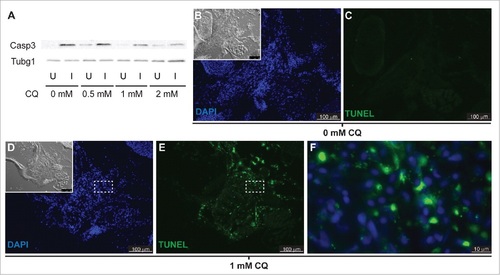
Apoptosis is not activated in response to autophagy inhibition. (A) Western blot of fish treated with increasing CQ concentrations showed a dose-dependent decrease of active Caspase 3 (Casp3) in the injured muscle (see Figure S1), suggesting a role of Casp3 in muscle regeneration. Protein loading was assayed with an anti-Tubg1/tubulin antibody. U, uninjured; I, injured. (B to F) Fish were treated with or without CQ. Apoptosis was visualized by TUNEL staining; the inset shows the differential interference contrast image (pictures are representative examples of 5 fish per group). (F) High-magnification view of the box in (D) and (E)shows cytoplasmic localization of TUNEL signal in fish treated with CQ. |
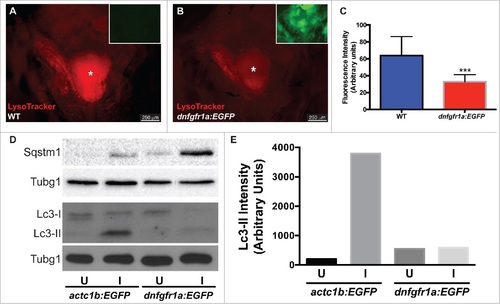
Autophagy is regulated by Fgf during EOM regeneration. (A, B) Craniectomy was again used to visualize LysoTracker Red-labeling in (A) wild-type (WT) fish, and (B) hsp70l:dnfgfr1a-EGFP; the inset shows an image of the GFP channel to confirm transgene expression and, consequently, Fgfr inhibition (pictures shown are representative examples of the 12 fish per group quantified). (C) Quantification of LysoTracker Red fluorescence intensity shows a clear decrease of LysoTracker Red labeling in hsp70l:dnfgfr1a-EGFP fish, indicating a lower autophagic flux. Values are averages ± SD (Student t test; ***, P < 0.001, n = 12). (D) Western blot of Sqstm1 and Lc3. The injured muscle of hsp70l:dnfgfr1a-EGFP fish showed higher levels of Sqstm1 and lower levels of Lc3-II (E), indicating again a lower autophagic flux. Protein loading was assayed with an anti-Tubg1/tubulin antibody. (D, E) Show a representative example of 3 independent experiments. U, uninjured; I, injured. * Skull base, where the pituitary is located. |