
|
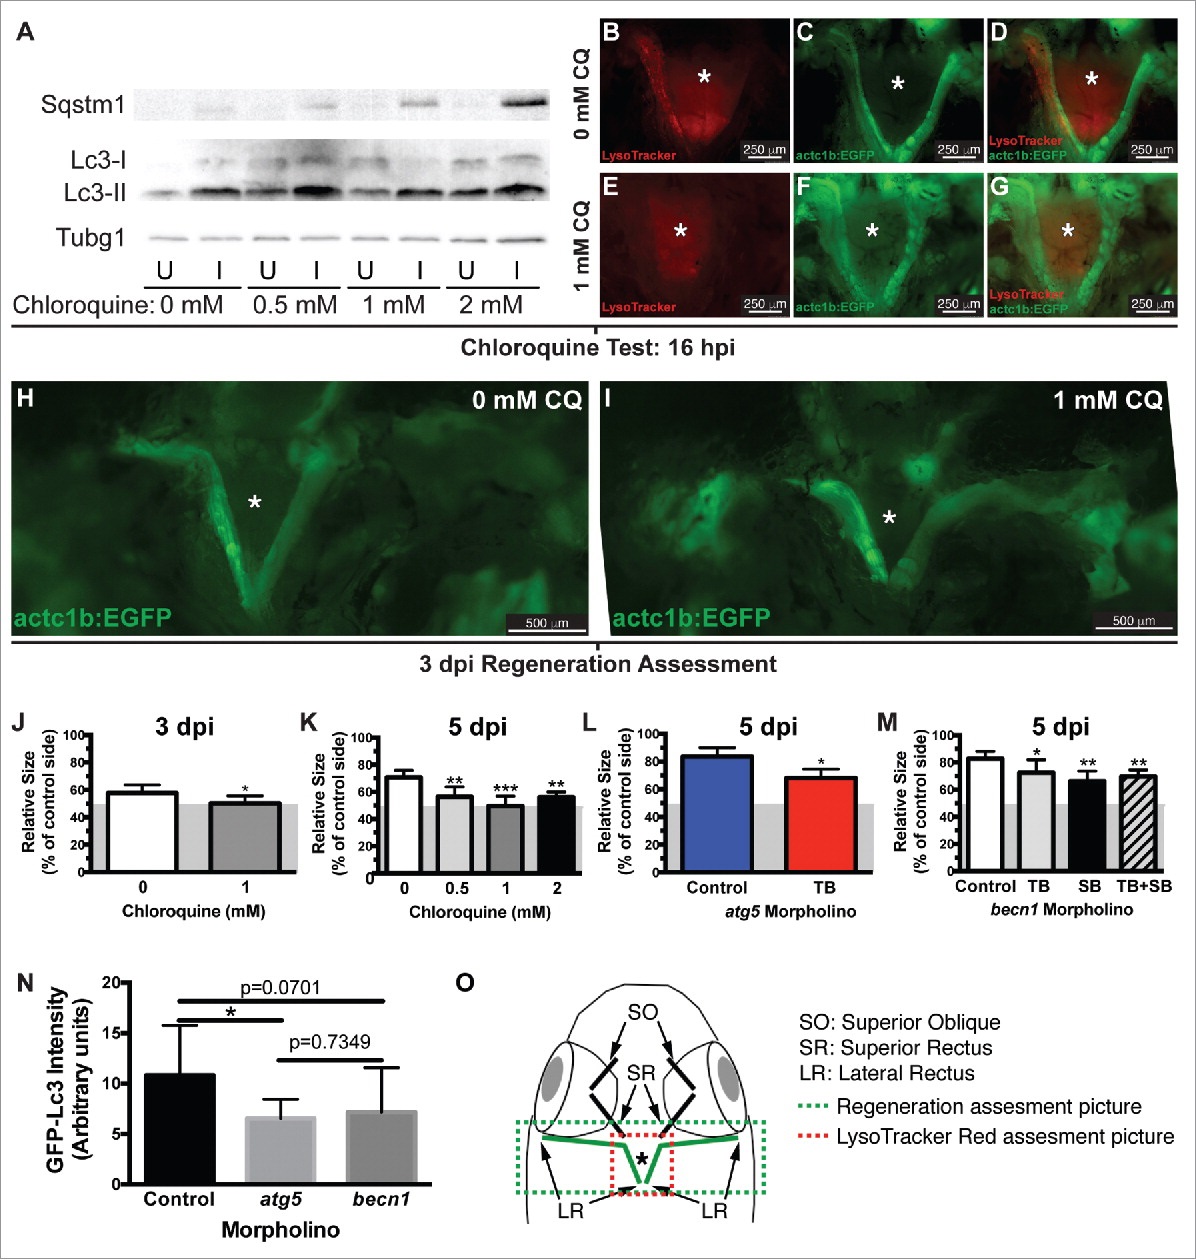
Fig. 3
Autophagy is required for EOM regeneration. (A) Western blot of fish treated with increasing CQ concentrations showed a dose-dependent increase of Sqstm1 in the injured muscle and Lc3-II in both injured and uninjured muscles (see Figure S1), indicating real autophagy flux. Protein loading was assayed with an anti-Tubg1 antibody. U, uninjured; I, injured. (B o G) The lack of LysoTracker Red staining in injured LR muscles of transgenic actc1b/α-actin:EGFP zebrafish (to visualize the muscles) using our craniectomy technique confirmed that CQ effectively blocked autophagy. (H to J) Craniectomy of an untreated (H) and CQ-treated fish (I) at 3 dpi; note the difference in length of the injured muscle between both groups (pictures are representative examples of 5 fish per group). (J) Quantification of LR muscle regeneration of fish shown in H and I; values are averages ± SD (Student t test, *, P < 0.05, n = 5). (K) Quantification of LR muscle regeneration at 5 dpi treated with different CQ concentrations; values are averages ± SD (One-way ANOVA, P < 0.0001, n=5; **, P < 0.01; ***, P < 0.001; Newman-Keuls multiple comparisons test). (L) Regeneration of LR muscles injected with control or atg5 translation-blocking (TB) MO was measured at 5 dpi; values are averages ± SD (Student t test, *, P < 0.05, n = 5). (M) Regeneration of LR muscles injected with control or becn1 MOs (translation-blocking, TB; splicing-blocking, SB; combination of both, TB+SB) was measured at 5 dpi; values are averages ± SD (Student t test; *, P < 0.05; **, P < 0.01, n = 5). (J to M) Since myectomy left approximately 50% of the muscle remaining, the measurements are shown for the entire regenerating muscle with a gray box indicating the approximate location of the myectomy site. (N) Fluorescence intensity of LR muscles of GFP-Lc3 fish injected with control, atg5 TB or becn1 TB+SB MOs was measured at 18 hpi; values are averages ± SD (Student t test; *, P < 0.05, n = 8). (O) Diagram of a craniectomized zebrafish head; muscles visualized by this technique are shown, and LR muscles are highlighted in green. Green and red boxes show approximately the picture used for regeneration or LysoTracker Red (or GFP-Lc3) assessment, respectively. * Skull base where the pituitary is located.