
- Title
-
Three-dimensional spatiotemporal focusing of holographic patterns
- Authors
- Hernandez, O., Papagiakoumou, E., Tanese, D., Fidelin, K., Wyart, C., Emiliani, V.
- Source
- Full text @ Nat. Commun.
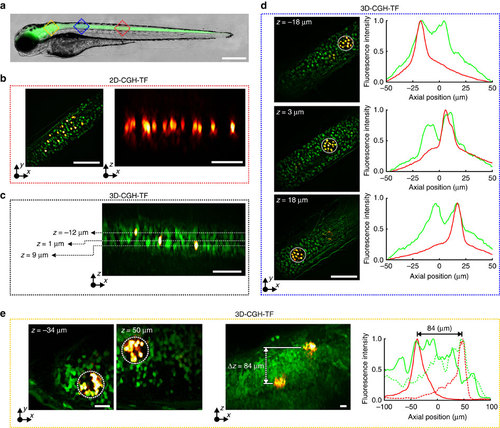
3D simultaneous 2P photoconversion of Kaede in vivo.(a) Merged brightfield and widefield fluorescence images of a double transgenic Tg(HuC:gal4; UAS:kaede) zebrafish larvae. Red and blue squares represent the approximate areas where we performed photoconversion. Scale bar, 400µm. (b) Left, overlaid green and red HiLo fluorescence images before and after photoconversion, respectively. Right, orthogonal maximum red fluorescence intensity projection showing 14 photoconverted neurons on a single axial plane (illumination density 0.4 mW µm-2, 200 pulses of 50 ms). Scale bars, 60 µm. (c) Orthogonal maximum fluorescence intensity projection of overlaid HiLo pre- and post-photoconversion images (green and red fluorescence, respectively). Three single cells were photoconverted on separated axial planes (4.0 mW µm-2, one pulse of 200 ms). Scale bar, 60 µm. (d) Simultaneous 3D photoconversion of neural ensembles in the spinal cord. Left, overlaid HiLo pre- and post-photoconversion fluorescence images, where three 35-µm-diameter holographic spots projected at z=-18 µm, 3 and 18 µm were used for photoconversion (0.03 mW µm-2, 2,000 pulses of 50 ms). Right, axial distributions of green pre- and red post-photoconversion integrated fluorescence intensity over z for the spots projected at the three different planes. Scale bars, 60 µm. (e) Simultaneous 3D photoconversion of neural ensembles in the zebrafish brain. Left, overlaid 2P-excited green- and red post-photoconversion fluorescence images, where two 35-µm-diameter holographic spots projected at z=-38 µm and 50 µm were used for photoconversion (0.11 mW µm-2, 9,000 pulses of 50 ms). Scale bar, 20 µm. Middle, Orthogonal maximum 2P-excited fluorescence intensity projection of overlaid green and red-post-photoconversion images. Scale bar, 20 µm. Right, axial distributions of green pre- and red post-photoconversion integrated 2P fluorescence intensity over z for the spot at z=-38 µm (solid lines) and the one at z=50 µm (dotted lines). z-values in all cases are given as distances from the focal plane of the objective, which for the spinal cord experiments was at ~60 µm and for the brain at ~90 µm from the fish surface (where green fluorescence was starting). Positive z-values are closer to the surface. λphot=800 nm. |
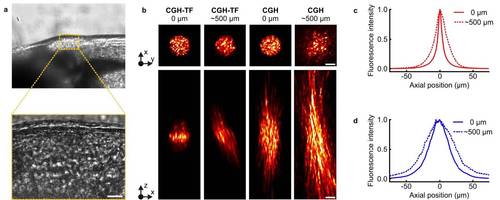
Propagation of CGH spots in the zebrafish brain. (a) Brightfield image of zebrafish larva brain, with a zoom in the area where we photoconverted neurons (bottom; see also area indicated in dark yellow box in Fig. 5a). Scale bar:20µm. To characterize the effect of light scattering of the specific sample we propagated CGH spots, with or without TF, through the brain. The fish was mounted on the lateral side facing up, as shown in Fig. 5a, and the laser beam propagated through the brain in the orthogonal direction (~500µm). The larva, anesthetized and embedded in agarose, was put on top of a glass coverslip spin-coated with a thin film of Rhodamine-6G. CGH spots passing through the brain excited 2P fluorescence that was collected and imaged through OBJ2 on the CCD camera (see experimental setup in Fig.1). (b) Top panels, from left to right: 2P excited fluorescence from a CGH-TF spot without scattering (0 µm of tissue) and after going through the brain (~500 µm of tissue), and from a CGH spot without scattering and after going through the brain. The numbers on top of the panels correspond to the thickness of the zebrafish tissue between the objective and the Rhodamine layer. Scale bars: 10 µm. Bottom panels: Corresponding x-z cross section of the 2P excited fluorescence for each case presented in the top panels. z-stacks were recorded by imaging a fixed plane with OBJ2, while scanning the excitation objective, OBJ1. (c) 2P fluorescence intensity distribution around the focal plane of OBJ1 (z = 0 µm) for a CGH-TF spot with (dashed curve) and without scattering (solid curve). The axial resolution degrades from 7.8 ± 0.3 µm without scattering to 23.2 ± 2.7 µm with scattering (FWHM values; mean ± s.d. propagation measurements repeated in 4 different locations). (d) Same as in c for a CGH spot with (dashed curve) and without scattering (solid curve). In this case the axial resolution changes from 33.7 ± 1.0 µm without scattering to 43.7 ± 5.7µm with scattering (FWHM values; mean ± s.d. propagation measurements repeated in 4 different locations). Transmission of laser light intensity after the tissue was about 25%. In agreement with experiments on rat brain4,5, these results revealed that although axial confinement of CGH-TF beam deteriorates with depth, still remains well below what is achievable with CGH alone. The tilt visible in the lateral view of axial propagations was already observed for shaped beam propagating through mice brain4,5, and is probably due to the refractive index mismatch in the surface of the tissue6. |