
|
Fig. S10
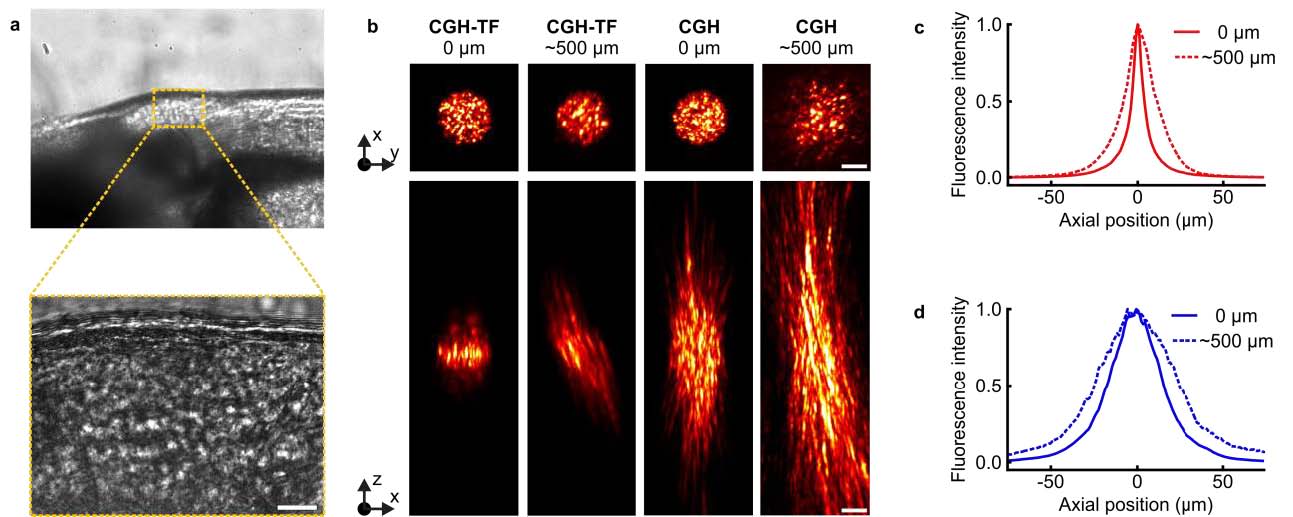
Propagation of CGH spots in the zebrafish brain. (a) Brightfield image of zebrafish larva brain, with a zoom in the area where we photoconverted neurons (bottom; see also area indicated in dark yellow box in Fig. 5a). Scale bar:20µm. To characterize the effect of light scattering of the specific sample we propagated CGH spots, with or without TF, through the brain. The fish was mounted on the lateral side facing up, as shown in Fig. 5a, and the laser beam propagated through the brain in the orthogonal direction (~500µm). The larva, anesthetized and embedded in agarose, was put on top of a glass coverslip spin-coated with a thin film of Rhodamine-6G. CGH spots passing through the brain excited 2P fluorescence that was collected and imaged through OBJ2 on the CCD camera (see experimental setup in Fig.1). (b) Top panels, from left to right: 2P excited fluorescence from a CGH-TF spot without scattering (0 µm of tissue) and after going through the brain (~500 µm of tissue), and from a CGH spot without scattering and after going through the brain. The numbers on top of the panels correspond to the thickness of the zebrafish tissue between the objective and the Rhodamine layer. Scale bars: 10 µm. Bottom panels: Corresponding x-z cross section of the 2P excited fluorescence for each case presented in the top panels. z-stacks were recorded by imaging a fixed plane with OBJ2, while scanning the excitation objective, OBJ1. (c) 2P fluorescence intensity distribution around the focal plane of OBJ1 (z = 0 µm) for a CGH-TF spot with (dashed curve) and without scattering (solid curve). The axial resolution degrades from 7.8 ± 0.3 µm without scattering to 23.2 ± 2.7 µm with scattering (FWHM values; mean ± s.d. propagation measurements repeated in 4 different locations). (d) Same as in c for a CGH spot with (dashed curve) and without scattering (solid curve). In this case the axial resolution changes from 33.7 ± 1.0 µm without scattering to 43.7 ± 5.7µm with scattering (FWHM values; mean ± s.d. propagation measurements repeated in 4 different locations). Transmission of laser light intensity after the tissue was about 25%. In agreement with experiments on rat brain4,5, these results revealed that although axial confinement of CGH-TF beam deteriorates with depth, still remains well below what is achievable with CGH alone. The tilt visible in the lateral view of axial propagations was already observed for shaped beam propagating through mice brain4,5, and is probably due to the refractive index mismatch in the surface of the tissue6.