
|
Fig. 5
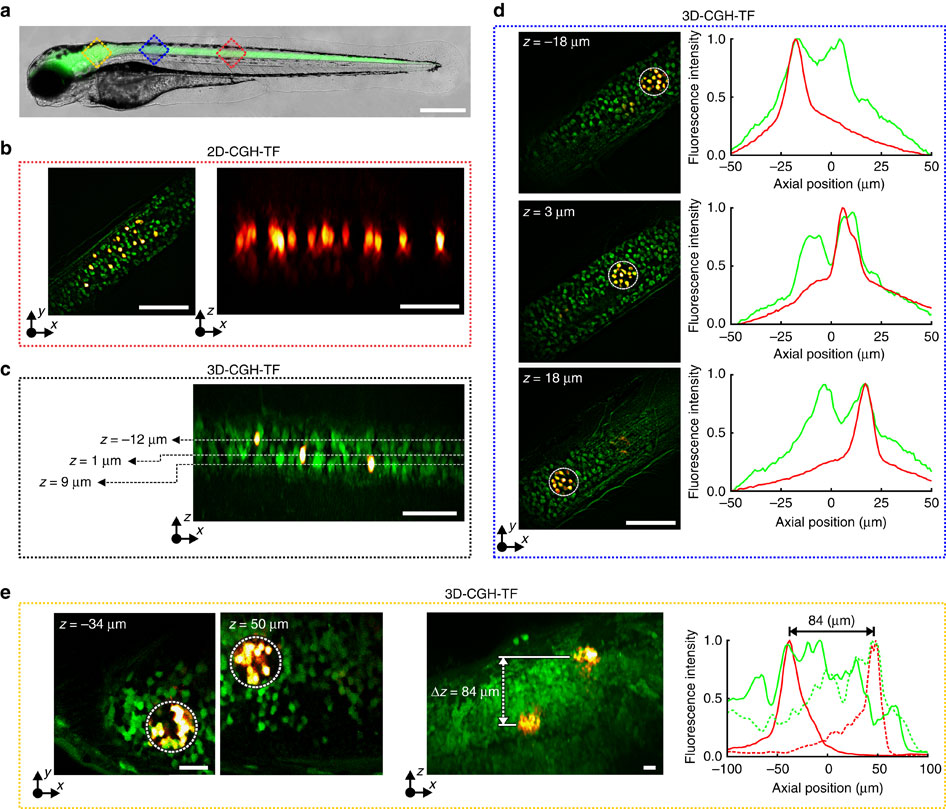
3D simultaneous 2P photoconversion of Kaede in vivo.(a) Merged brightfield and widefield fluorescence images of a double transgenic Tg(HuC:gal4; UAS:kaede) zebrafish larvae. Red and blue squares represent the approximate areas where we performed photoconversion. Scale bar, 400µm. (b) Left, overlaid green and red HiLo fluorescence images before and after photoconversion, respectively. Right, orthogonal maximum red fluorescence intensity projection showing 14 photoconverted neurons on a single axial plane (illumination density 0.4 mW µm-2, 200 pulses of 50 ms). Scale bars, 60 µm. (c) Orthogonal maximum fluorescence intensity projection of overlaid HiLo pre- and post-photoconversion images (green and red fluorescence, respectively). Three single cells were photoconverted on separated axial planes (4.0 mW µm-2, one pulse of 200 ms). Scale bar, 60 µm. (d) Simultaneous 3D photoconversion of neural ensembles in the spinal cord. Left, overlaid HiLo pre- and post-photoconversion fluorescence images, where three 35-µm-diameter holographic spots projected at z=-18 µm, 3 and 18 µm were used for photoconversion (0.03 mW µm-2, 2,000 pulses of 50 ms). Right, axial distributions of green pre- and red post-photoconversion integrated fluorescence intensity over z for the spots projected at the three different planes. Scale bars, 60 µm. (e) Simultaneous 3D photoconversion of neural ensembles in the zebrafish brain. Left, overlaid 2P-excited green- and red post-photoconversion fluorescence images, where two 35-µm-diameter holographic spots projected at z=-38 µm and 50 µm were used for photoconversion (0.11 mW µm-2, 9,000 pulses of 50 ms). Scale bar, 20 µm. Middle, Orthogonal maximum 2P-excited fluorescence intensity projection of overlaid green and red-post-photoconversion images. Scale bar, 20 µm. Right, axial distributions of green pre- and red post-photoconversion integrated 2P fluorescence intensity over z for the spot at z=-38 µm (solid lines) and the one at z=50 µm (dotted lines). z-values in all cases are given as distances from the focal plane of the objective, which for the spinal cord experiments was at ~60 µm and for the brain at ~90 µm from the fish surface (where green fluorescence was starting). Positive z-values are closer to the surface. λphot=800 nm.