- Title
-
Functional Profiles of Visual-, Auditory-, and Water Flow-Responsive Neurons in the Zebrafish Tectum
- Authors
- Thompson, A.W., Vanwalleghem, G.C., Heap, L.A., Scott, E.K.
- Source
- Full text @ Curr. Biol.
|
Experimental Setup for Calcium Imaging of Neural Responses to Stimuli across Three Modalities (A) A schematic of the experimental setup. Zebrafish larvae were exposed to four visual stimuli, two lateral line stimuli, and an auditory stimulus while neuronal activity was simultaneously imaged using SPIM. (B) Pan-neuronal GCaMP5G was imaged in the tectum from a dorsal perspective, orthogonal to the illumination plane. Individual cells (yellow) were automatically segmented using custom-written code in MATLAB. (C) A raster plot of the change in fluorescence over time for each cell in a single experimental trial. Defined patterns of activity were observed in response to the presentation of the various sensory stimuli (vertical bar, red; horizontal bar, purple; full-field flash, blue; small spot, green; water flow, light green; auditory tone, orange). |
|
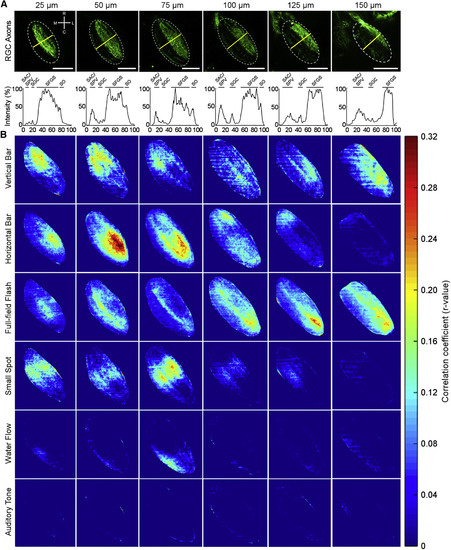
Different Visual and Non-visual Stimuli Selectively Activate Different Parts of the Tectal Neuropil (A) Kaede expression in retinal ganglion cell axons in the tectal neuropil (dotted outline) of a 6-dpf Atho7:Gal4;UAS:Kaede larva at each imaging depth. The neuropil layers are identified by the fluorescence profile across the axis outlined by the yellow line in each panel. SO, stratum opticum; SFGS, stratum fibrosum et griseum superficiale; SGC, stratum griseum centrale; SAC/SPV, stratum album centrale/stratum periventriculare. Scale bars, 50 µm. (B) The average correlation between the presentation of each stimulus and the GCaMP5G responses in the tectal neuropil is shown for each depth. Visual responses in the neuropil are seen to have higher correlations to the stimulus presentation than non-visual responses, with apparent separation of the regions responsible for processing different visual stimuli. Each panel represents the average correlation of 11 fish. See also Figure S6. EXPRESSION / LABELING:
|
|
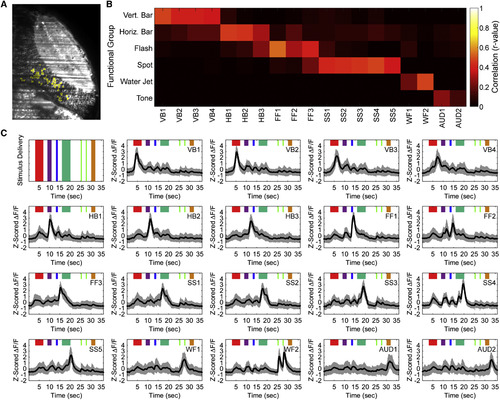
Responses of Cells in the Tectal PVL to Both Visual and Non-visual Stimuli (A) An example ensemble of neurons (yellow) with functionally similar response profiles defined by PCA-promax. (B) Classification of different functional clusters by linear regression to the presentation of each of the six sensory stimuli. Four vertical bar-responsive, three horizontal bar-responsive, three full-field flash-responsive, five small spot-responsive, two water flow-responsive, and two auditory tone-responsive clusters were identified. (C) The average (black) and SD (gray) of the responses of the different functional clusters produced by PCA-promax, ordered sequentially by peak response. Clusters are assigned names (top right of each panel) indicating the stimulus to which they respond and the chronological order among clusters responsive to the same stimulus. Colors represent the presentations of stimuli as per Figure 1 C. See also See also Figures S2, S3, S4, and S5. |
|
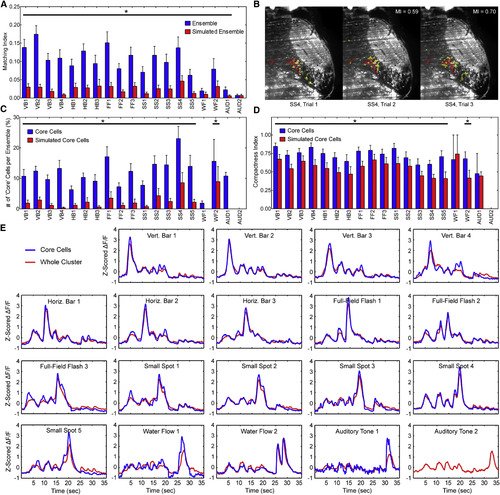
Highly Variable Ensembles Are Anchored by Reliably Responding Core Cells (A) The average pairwise matching index across all trials for each ensemble of cells is low but significantly higher than that of a simulated ensemble with the same local distribution of cells. The AUD2 cluster provides one exception (*p < 0.01, Wilcoxon signed-rank test; error bars, SEM). (B) An example ensemble of cells from SS4 cluster (small spot-responsive) in three repeated trials. The cellular composition of the ensemble is more varied between trial 1 and 2 (matching index [MI] = 0.59) than between trials 2 and 3 (MI = 0.70). Core cells present in at least 80% of trials are red; non-core cells are yellow. (C) A significantly higher proportion of core cells exist in all ensembles from visual-responsive clusters and WF2 than expected by chance (*p < 0.01, Wilcoxon signed-rank test; error bars, SEM). The AUD2 cluster contained no core cells. (D) The core cells within an ensemble are significantly more compact in all visual stimuli-responsive clusters and the second water flow-responsive cluster than a simulated core within each ensemble (*p < 0.01, Wilcoxon signed-rank test; error bars, SEM). (E) The average response of core cells is broadly similar to that of the whole cluster, although there is a trend toward stronger responses to the salient stimulus feature. |
|
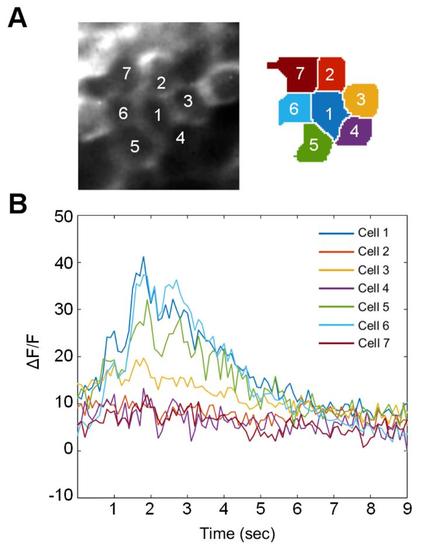
Figure S1, related to Figure 1. Effect of light scattering on signal detection from adjacent cells. (A) A small group of cells sharing borders with a central cell (Cell 1). The area contains seven whole neurons, which are shown on the right after segmentation. (B) The raw ΔF/F signals of the cells during a single trial in response to a visual stimulus. The responses of some cells (1, 5, and 6) are similar but distinct, while others with extensive borders to these cells show no similarity. This indicates that the reported signals correspond to each cell’s intrinsic activity, rather than scattered light from adjacent cells. |
|
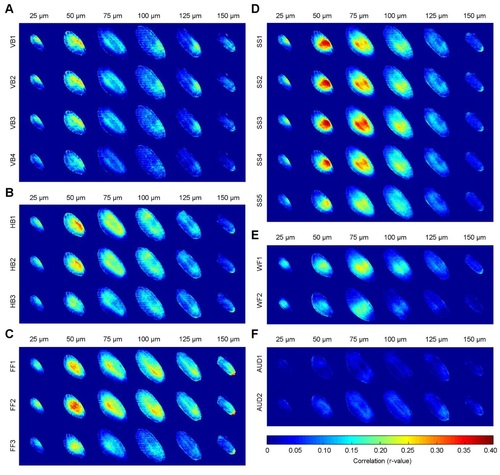
Figure S6, related to Figure 2 and Figure 4. Different visual and non-visual clusters correlate with activation in different parts of the tectal neuropil. (A) The average correlation between GCaMP5G fluorescence across the neuropil and a vertical bar stimulus for each of the four vertical bar-responsive clusters, shown for each of the six depths analyzed. The correlations for all vertical bar-responsive clusters appear similar, with the strongest correlation seen in the superficial areas, especially at 50 µm of depth. (B-F) As for panel (A), except showing correlations against the horizontal bar- (B), full-field flash- (C), small spot- (D), water flow- (E), and auditory tone-responsive (F) clusters. Visual clusters produce the strongest correlations due to the high proportion of retinal ganglion cell axons in the neuropil, with some clear preferences for stimuli in different neuropil regions across different depths. Each image represents the average correlation of eleven animals, registered against an average neuropil template, resulting in some minor registration artifacts at the edges in some instances. |


