
IMAGE
Fig. S6
- ID
- ZDB-IMAGE-160420-16
- Publication
- Thompson et al., 2016 - Functional Profiles of Visual-, Auditory-, and Water Flow-Responsive Neurons in the Zebrafish Tectum
- All Figures
- Figures for Thompson et al., 2016
Image
|
Figure Caption
Fig. S6
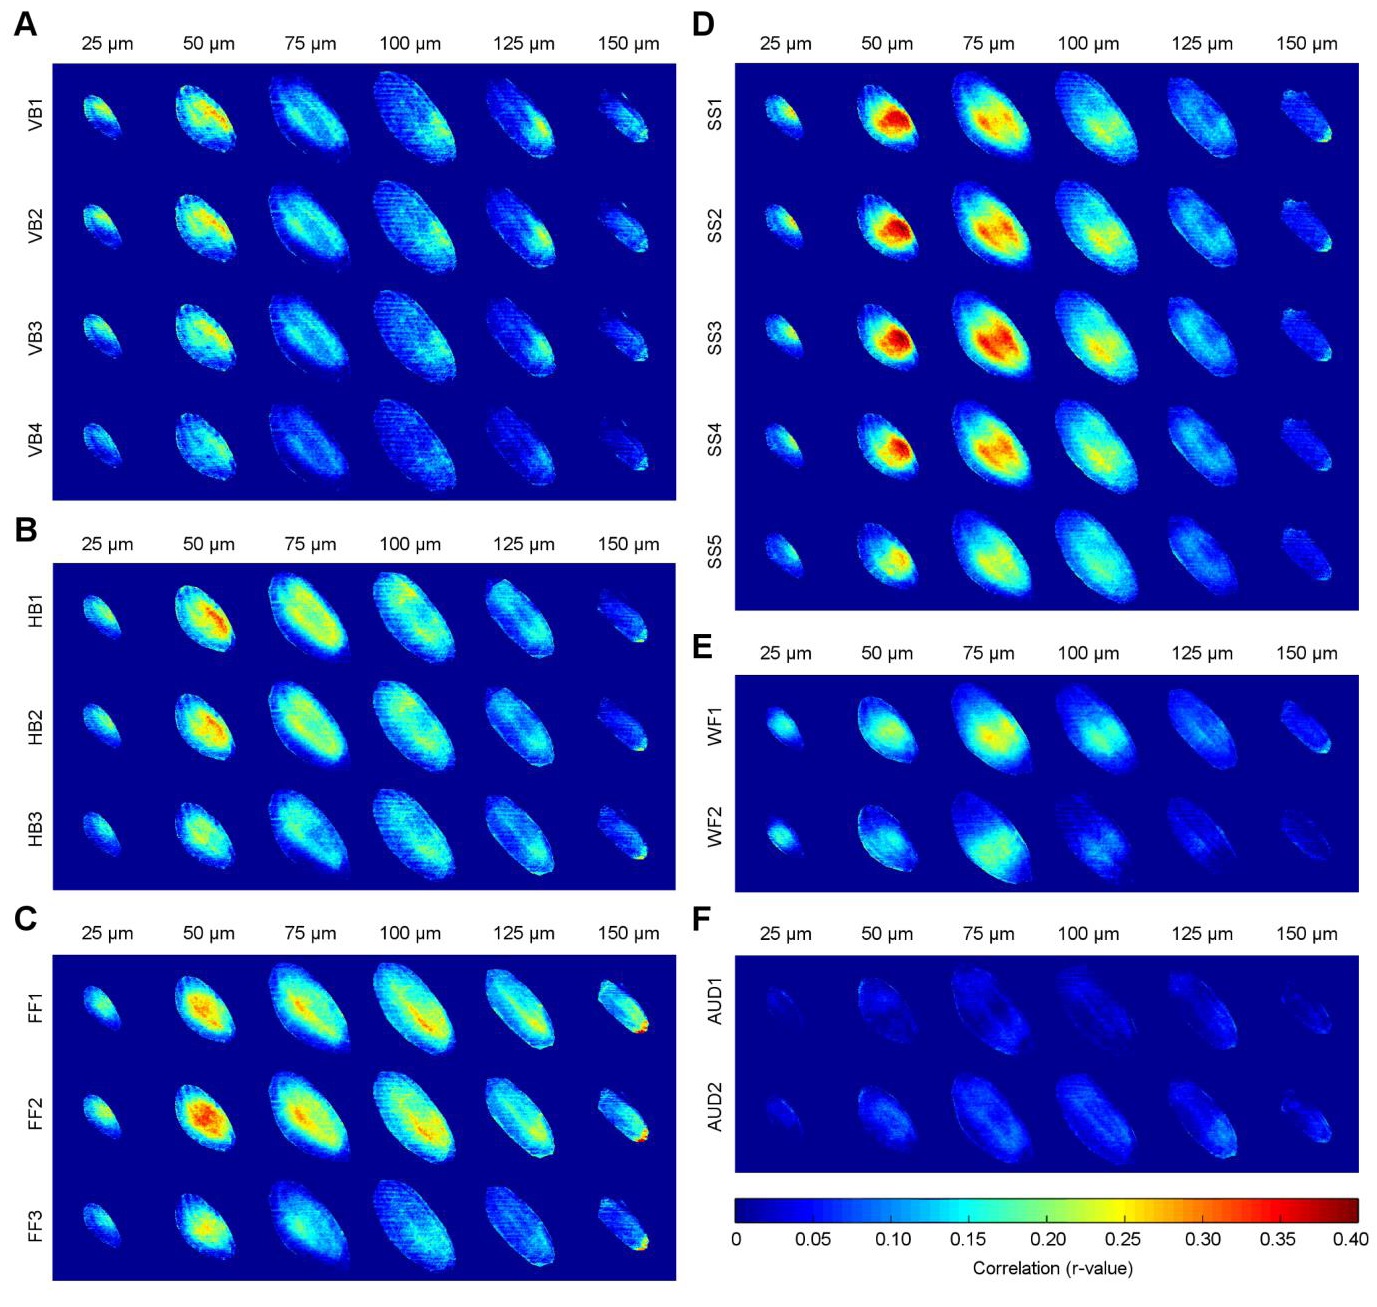
Figure S6, related to Figure 2 and Figure 4. Different visual and non-visual clusters correlate with activation in different parts of the tectal neuropil.
(A) The average correlation between GCaMP5G fluorescence across the neuropil and a vertical bar stimulus for each of the four vertical bar-responsive clusters, shown for each of the six depths analyzed. The correlations for all vertical bar-responsive clusters appear similar, with the strongest correlation seen in the superficial areas, especially at 50 µm of depth. (B-F) As for panel (A), except showing correlations against the horizontal bar- (B), full-field flash- (C), small spot- (D), water flow- (E), and auditory tone-responsive (F) clusters. Visual clusters produce the strongest correlations due to the high proportion of retinal ganglion cell axons in the neuropil, with some clear preferences for stimuli in different neuropil regions across different depths. Each image represents the average correlation of eleven animals, registered against an average neuropil template, resulting in some minor registration artifacts at the edges in some instances.
Acknowledgments
This image is the copyrighted work of the attributed author or publisher, and
ZFIN has permission only to display this image to its users.
Additional permissions should be obtained from the applicable author or publisher of the image.
Full text @ Curr. Biol.