
|
Fig. 3
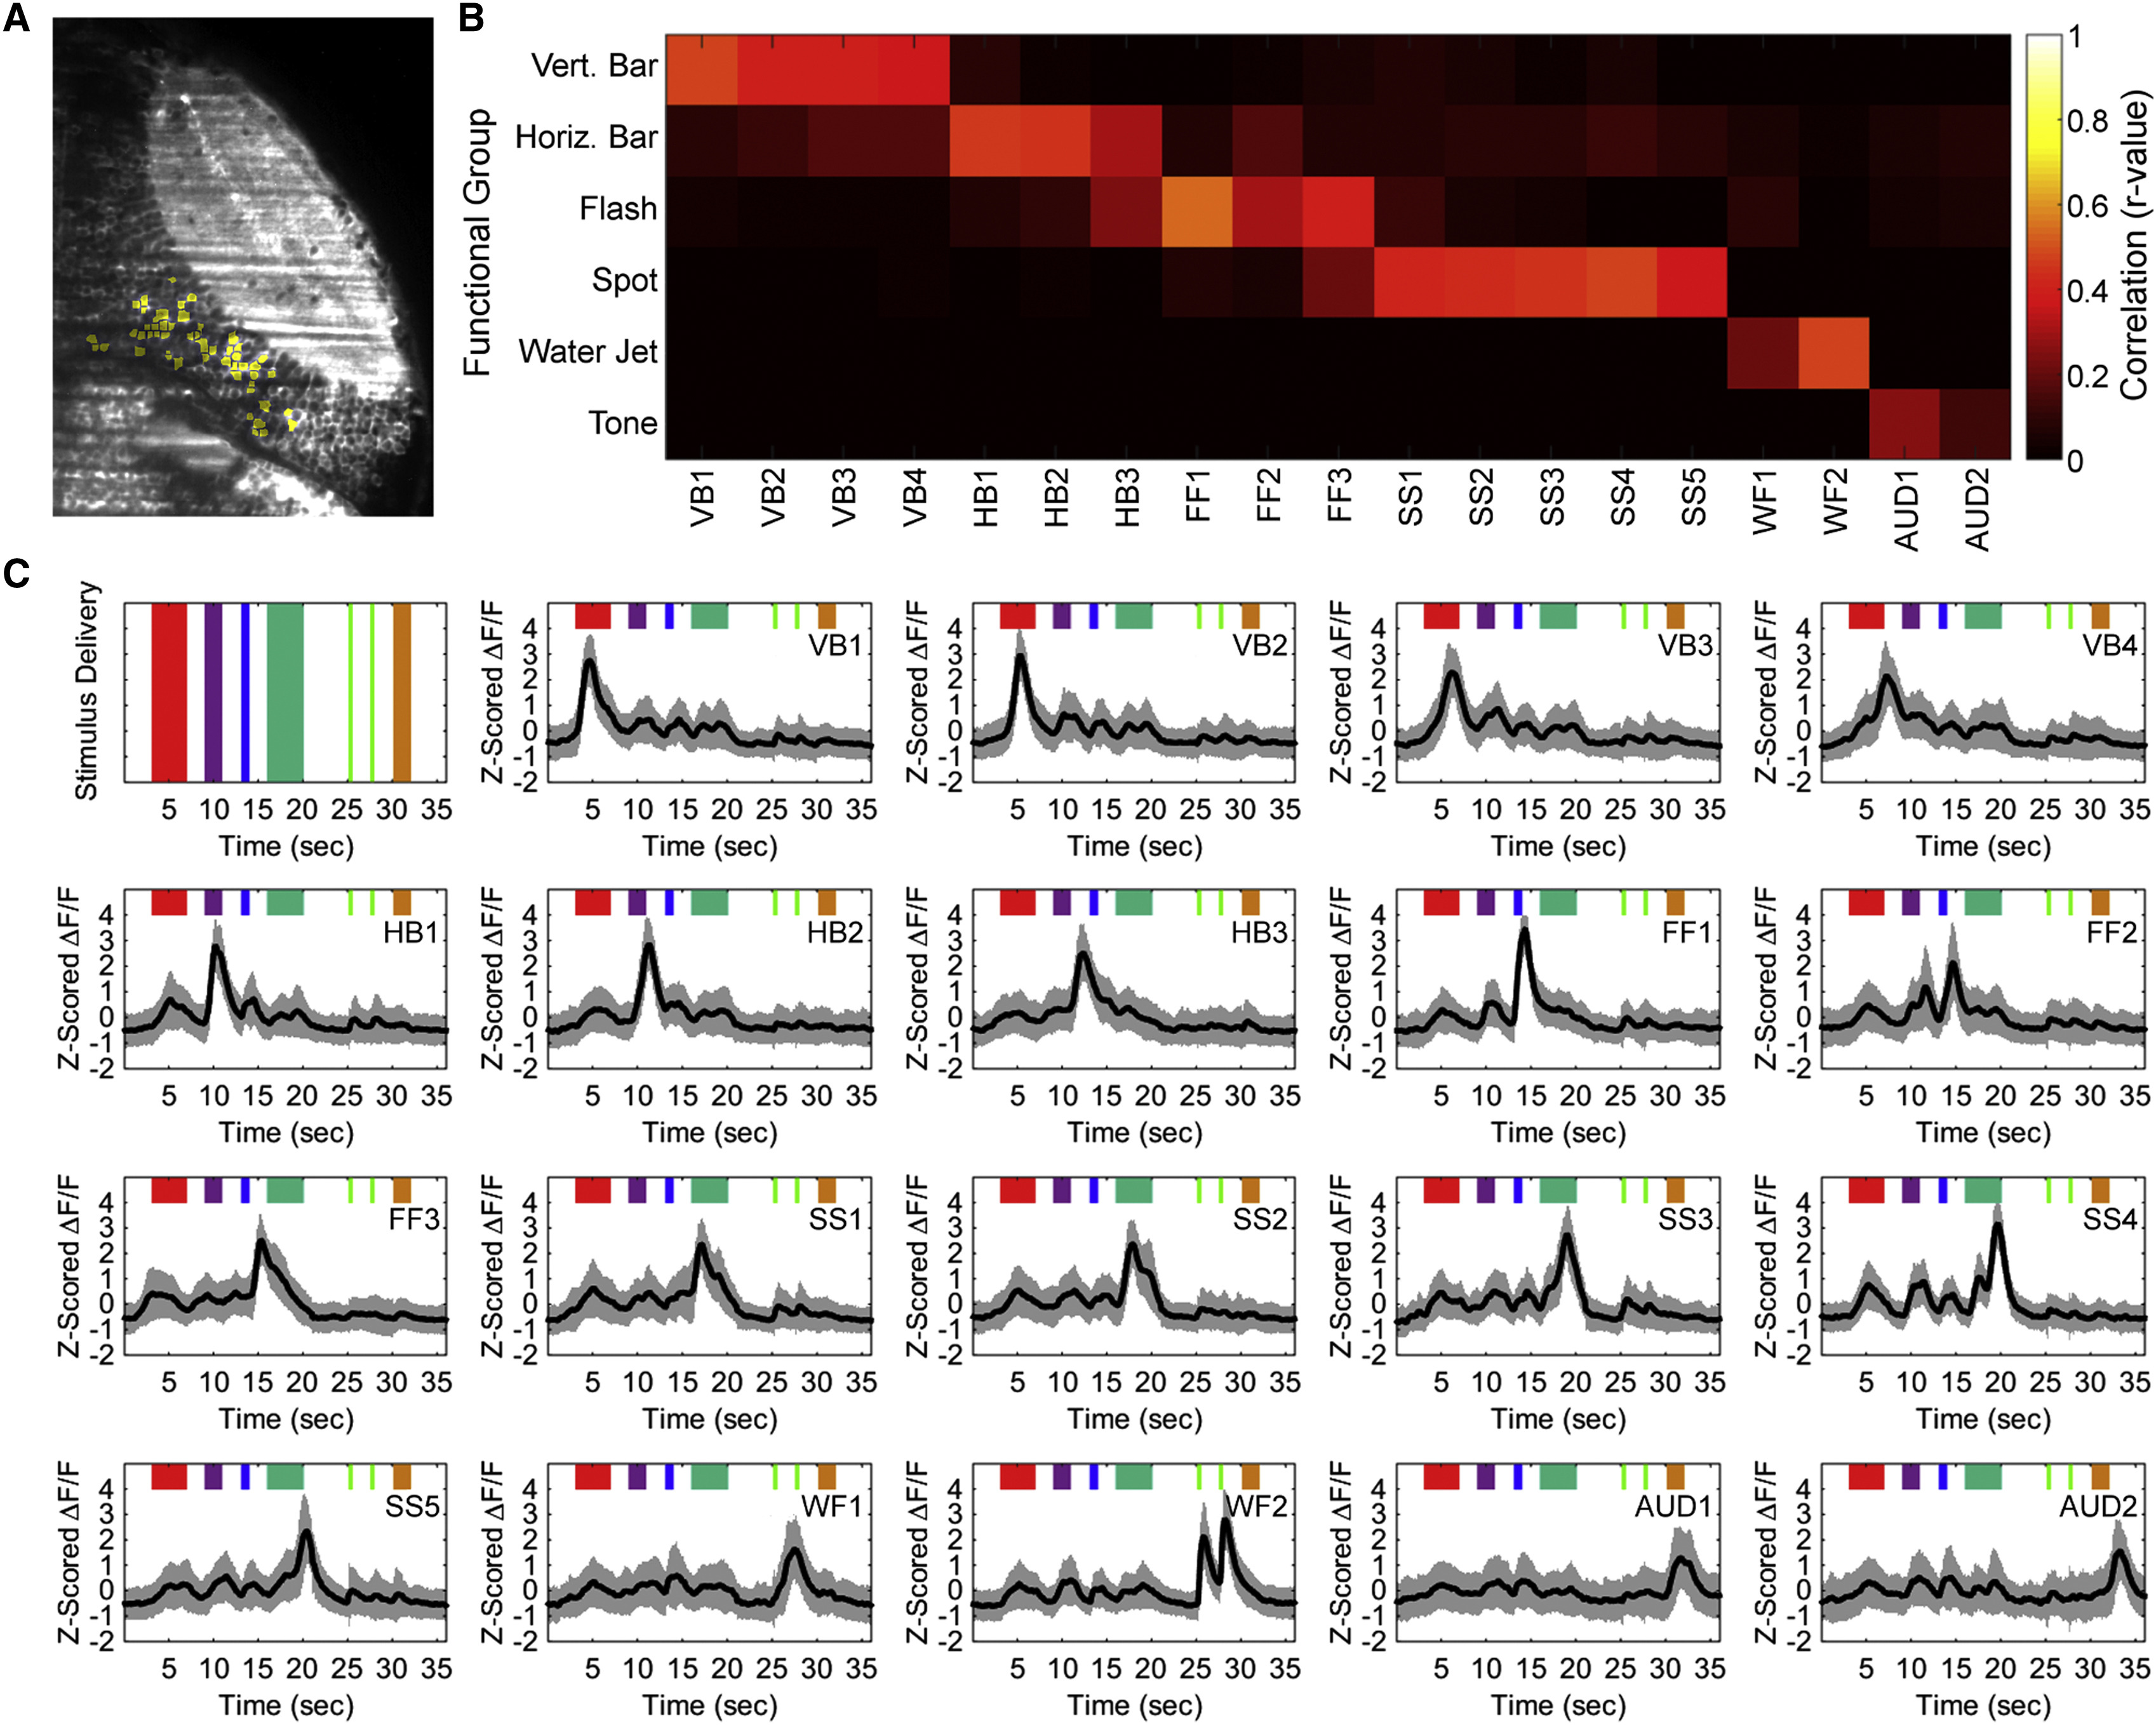
Responses of Cells in the Tectal PVL to Both Visual and Non-visual Stimuli
(A) An example ensemble of neurons (yellow) with functionally similar response profiles defined by PCA-promax.
(B) Classification of different functional clusters by linear regression to the presentation of each of the six sensory stimuli. Four vertical bar-responsive, three horizontal bar-responsive, three full-field flash-responsive, five small spot-responsive, two water flow-responsive, and two auditory tone-responsive clusters were identified.
(C) The average (black) and SD (gray) of the responses of the different functional clusters produced by PCA-promax, ordered sequentially by peak response. Clusters are assigned names (top right of each panel) indicating the stimulus to which they respond and the chronological order among clusters responsive to the same stimulus. Colors represent the presentations of stimuli as per Figure 1 C.
See also See also Figures S2, S3, S4, and S5.