
|
Fig. 2
Different Visual and Non-visual Stimuli Selectively Activate Different Parts of the Tectal Neuropil
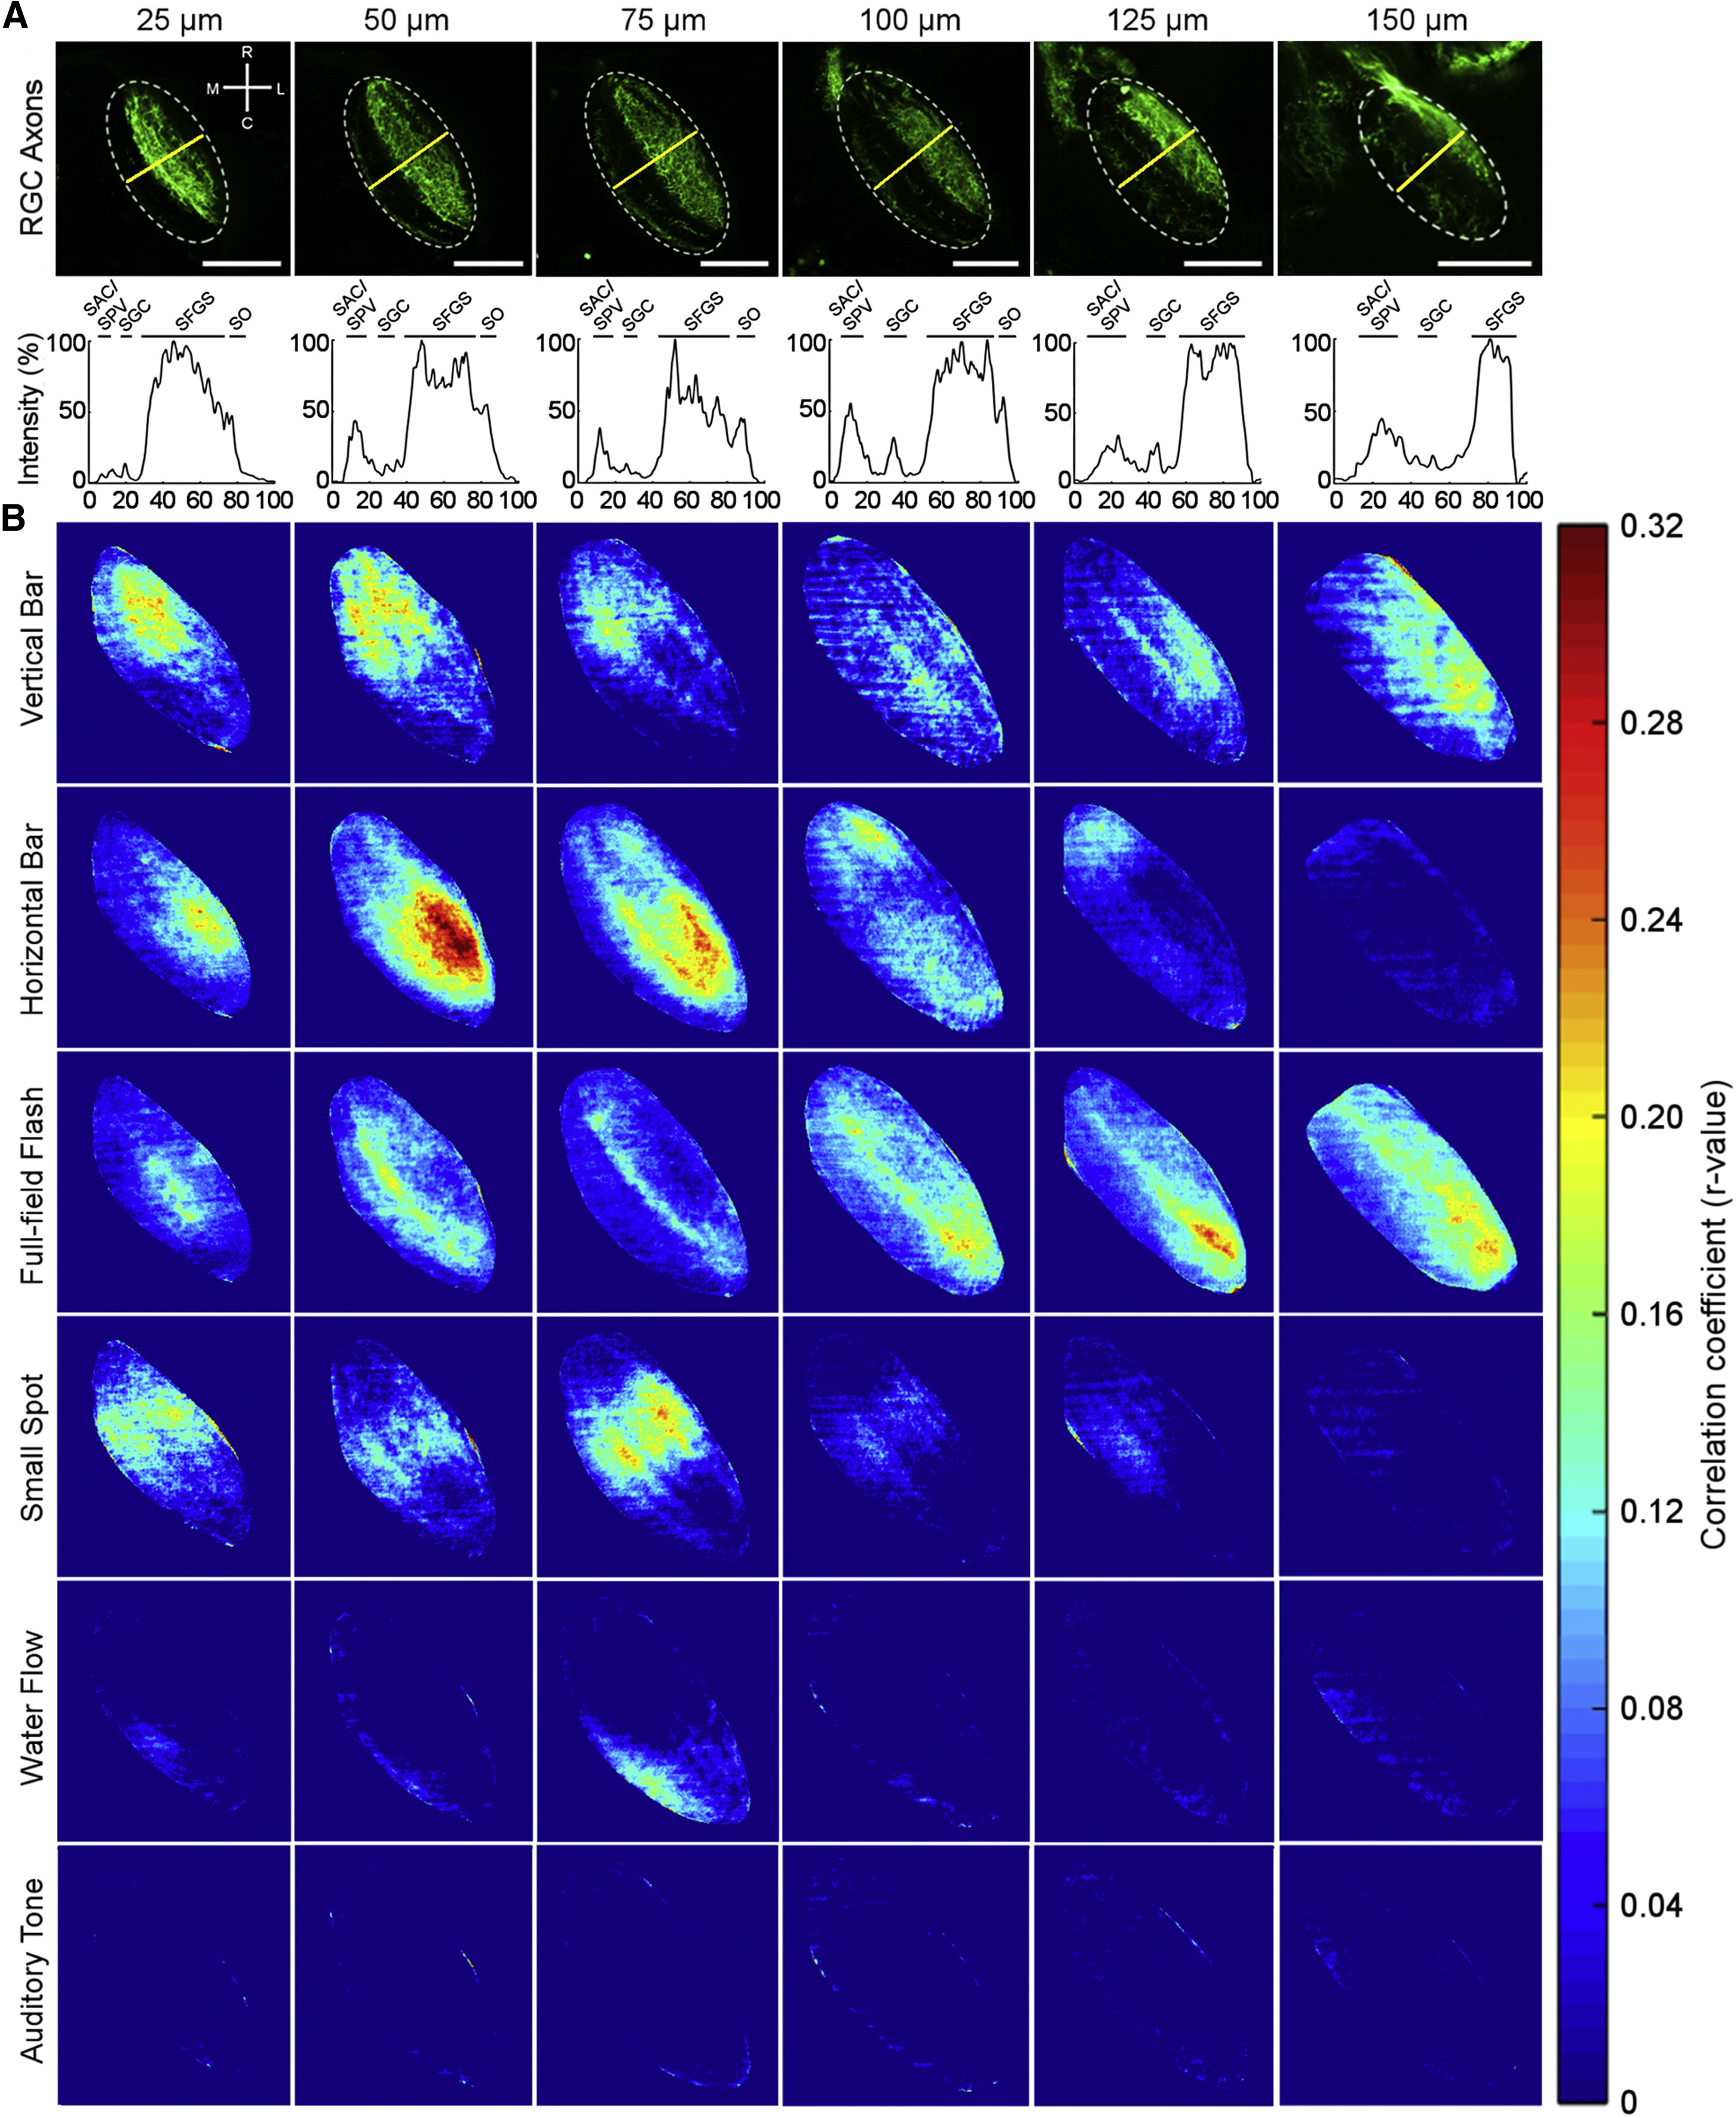
(A) Kaede expression in retinal ganglion cell axons in the tectal neuropil (dotted outline) of a 6-dpf Atho7:Gal4;UAS:Kaede larva at each imaging depth. The neuropil layers are identified by the fluorescence profile across the axis outlined by the yellow line in each panel. SO, stratum opticum; SFGS, stratum fibrosum et griseum superficiale; SGC, stratum griseum centrale; SAC/SPV, stratum album centrale/stratum periventriculare. Scale bars, 50 µm.
(B) The average correlation between the presentation of each stimulus and the GCaMP5G responses in the tectal neuropil is shown for each depth. Visual responses in the neuropil are seen to have higher correlations to the stimulus presentation than non-visual responses, with apparent separation of the regions responsible for processing different visual stimuli. Each panel represents the average correlation of 11 fish.
See also Figure S6.