- Title
-
Gmnc Is a Master Regulator of the Multiciliated Cell Differentiation Program
- Authors
- Zhou, F., Narasimhan, V., Shboul, M., Chong, Y.L., Reversade, B., Roy, S.
- Source
- Full text @ Curr. Biol.
|
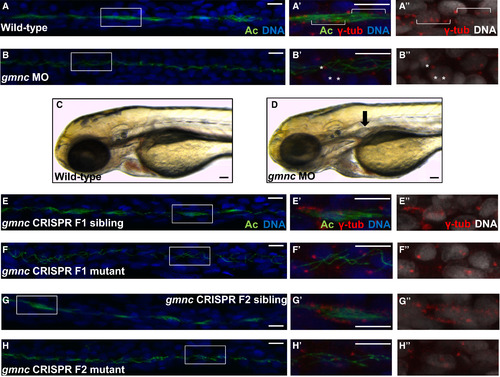
Gmnc Is Required for MCC Formation in the Kidney Tubules of the Zebrafish Embryo (A and B) The kidney tubules of 48 hr post-fertilization (hpf) wild-type embryos are populated with clusters of MCCs (A). Boxes delineate the regions imaged at a higher magnification in (A′) and (A′′). Multiple basal bodies are indicated by brackets (A′ and A′′). In contrast, 100% (n = 47, from two independent experiments) of the gmnc splice-blocking MO-injected embryos were devoid of MCCs (B and B′). Examples of single basal bodies are marked by asterisks (B′ and B′′). Acetylated-tubulin (Ac; green), DAPI (DNA; blue; rendered in black and white in A′′ and B′′), and γ-tubulin (marks basal bodies; red; for A′, A′′, B′, and B′′ only). (C and D) In contrast to wild-type embryos (C), kidney cysts (black arrow) form in 3-day-old gmnc morphants (93%, n = 40) (D). (E and F) The F1 generation from intercrossed F0 gmnc CRISPR mutants was a mixture of wild-type animals (E) and animals carrying the gmnc deletion (F). The kidney tubules of the latter did not harbor MCCs at 36 hpf. (G and H) Approximately one-quarter (two different pairs of F1 heterozygotes were analyzed; pair 1: 26%, n = 31; pair 2: 27%, n = 44) of the F2 generation from intercrossed heterozygous F1 parents lacked MCCs in the kidney tubules at 36 hpf (H). The other three-quarters of the embryos appeared wild-type (G). Scale bars, 10 µm (C and D); 5 µm (all others). See also Figure S1. EXPRESSION / LABELING:
PHENOTYPE:
|
|
Gmnc Functions Downstream of Notch Activation and Upstream of mcidas (A-C) At 48 hpf, the kidney tubules of mib mutant embryos display supernumerary MCCs, which appear as a contiguous bundle (B), in contrast to wild-type embryos, whose kidney tubules harbor distinct clusters of MCCs (A). A majority of the mib embryos injected with the gmnc MO were devoid of MCCs (75%; n = 10) (C), replicating the phenotype of the gmnc morphants ( Figure 1B). Acetylated-tubulin, green; DAPI, blue. (D and E) Similar to the mib mutants (B), jagged2a morphants at 48 hpf harbor supernumerary MCCs lining the kidney tubules (D). Embryos co-injected with jagged2a and gmnc MOs exhibited the gmnc morphant phenotype and lacked MCCs (100%; n = 10) (E). (F-H) At 24 hpf, the zebrafish mcidas gene is expressed in the kidney tubules in a spotted pattern (asterisks) that corresponds to the MCC precursors (F). mcidas expression domain is expanded in mib mutant embryos (G) and is completely lost when gmnc is knocked down in the mib background (100%; n = 20) (H). (I and J) The Tg(foxj1b::GFP) reporter fish strain (T2BGSZ10) reveals that, at 24 hpf, foxj1b is expressed in the MCC precursor cells of the kidney ducts (I). foxj1b::GFP expression was lost in the gmnc MO-injected T2BGSZ10 embryos (100%; n = 16) (J). GFP (foxj1b), green; DAPI, blue. Scale bars, 50 µm (F-H); 10 µm (all others). See also Figure S2. |
|
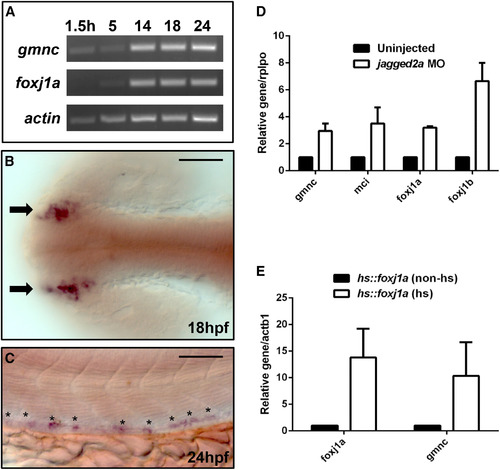
gmnc Is Expressed in the Kidney Tubules and Is Modulated by Notch Signaling and Foxj1a Activation (A) End-point PCRs on cDNA extracted from 1.5, 5, 14, 18, and 24 hpf embryos, respectively, revealed that whereas the maternal contribution of the foxj1a transcript is minimal (1.5 hr), the gmnc transcript is maternally deposited. actin-b1 (actb1) was used as the loading control. (B and C) Representative staining from in situ hybridization using a probe against gmnc showed that the gene is expressed in the developing nasal placodes (arrows) at 18 hpf (B) and is also expressed in a spotted pattern in the mid-section of the kidney ducts (asterisks) at 24 hpf (C). Scale bars, 50 µm. (D) qPCRs were performed on uninjected or jagged2a MO-injected embryos at 24 hpf. Similar to the ciliogenic genes like foxj1a, foxj1b, and mcidas (mci), whose levels increased in the N-deficient background, gmnc transcript levels also increased moderately (by ~3-fold). Expression levels in the uninjected condition were arbitrarily assigned a value of 1. rplpo was used as an internal (loading) control. Error bars represent the SEM from two independent experiments. (E) qPCRs were performed on non-heat-shocked or heat-shocked Tg(hsp70::foxj1a) embryos. The heat-shock treatment induced the foxj1a transgene level by ~15-fold, and the foxj1a overexpression induced the gmnc level by ~10-fold. Expression levels in the non-heat-shocked condition were arbitrarily assigned a value of 1. actin-b1 (actb1) was used as an internal (loading) control. Error bars represent the SEM from three independent experiments. |
|
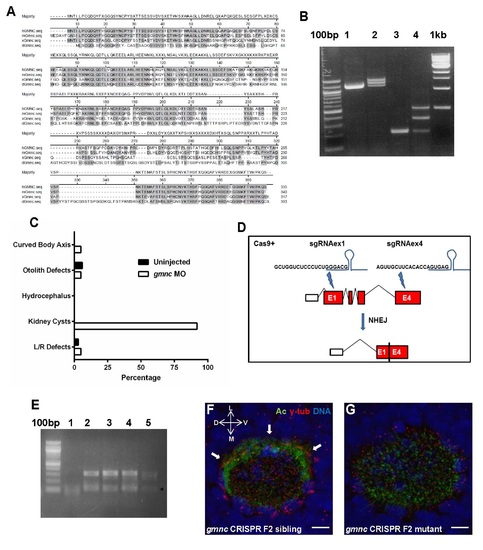
Sequence comparisons of Gmnc orthologs, efficacy of splicing inhibition by the zebrafish gmnc splice blocking MO, scoring of ciliary dysfunction-associated phenotypes in gmnc MO embryos, CRISPR/Cas9-mediated deletion in the zebrafish gmnc genomic region, and defects in cilia formation in the embryonic nasal placode in gmnc mutants (A) Gmnc amino acid sequences from human (hGMNC), mouse (mGmnc), Xenopus (xGmnc) and zebrafish (dGmnc) proteins were aligned using the Clustal W method. Regions of homology among the four species are shaded. (B) The gmnc splice morpholino was designed to inhibit splicing at the exon 2/intron2-3 junction of the zebrafish gmnc pre-mRNA. To verify its efficacy, cDNAs from 24 hpf wild-type (lane 1) and gmnc morpholino injected (lane 2) embryos were used in end-point PCRs to amplify the 1.1kb-long gmnc coding sequence. A single band of the expected size was amplified from the wild-type, while 3 bands of incremental sizes were amplified from the morphant. To resolve the identity of these bands, primers were designed to amplify across the 319 bp-long intron 2-3, with an expected PCR product size of ~200 bp from the wild-type (lane 3). This strategy revealed two additional bands in the morphants (lane 4), with the ~500bp band corresponding to the PCR product that includes the retained intron 2-3. (C) Five ciliary phenotypes were scored in uninjected zebrafish embryos or gmnc MO-injected embryos: The extent of body axis curvature, otolith defects in the inner ear (other than two), swelling of the brain ventricles (hydrocephalus), kidney cysts, and heart looping directionality (L/R defects) (n=40). The morphants did not exhibit any overt ciliary dysfunctional phenotypes other than the prevalent formation of kidney cysts. (D and E) Schematic showing the CRIPSR/Cas9-mediated genome modification at the zebrafish gmnc locus designed to excise a region between exons 1 and 4, using two guide RNAs (sgRNAex1 and sgRNAex4). After non-homologous end-joining (NHEJ) repair, the modified genomic locus would only contain part of exon 1 and exon 4 fused, lacking the intervening sequences (D). Primers flanking the deletion region were used to identify fish carrying the deletion (lanes 2 to 5, with an expected PCR product size of ~350bp, which was then sequenced to verify the region of the deletion) versus wild-type animals (lane 1, where the ~350bp product should be absent) (E). The lower bands (asterisk) are probably non-specific PCR product(s). (F and G) A prominent band of MCCs (indicated by arrows) decorate the lateral circumference of the embryonic nasal placode at 72hpf (F). This MCC band was completely lost in the gmnc mutant embryos (100%, n=10) (G). Acetylated-tubulin (Ac; green), γ- tubulin (red), DAPI (blue). D: dorsal; V: ventral; L: lateral; M: medial. Scale bars: 5µm. |
|
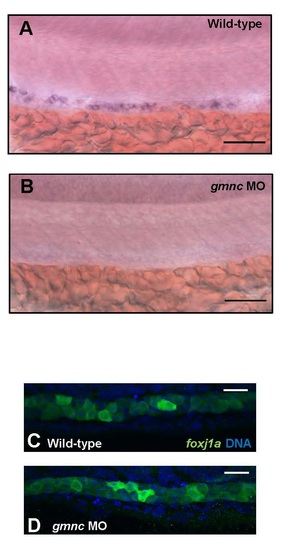
rfx2 expression is dependent on Gmnc, while the expression of foxj1a does not require Gmnc (A and B) At 24 hpf, the zebrafish rfx2 expression is enriched in MCC precursor cells, staining the kidney tubules in a spotted pattern (A). Its expression is lost in the gmnc morphants (100%, n=20) (B). Scale bars: 50µm. (C and D) The Tg(0.6foxj1a::GFP) reporter fish strain reveals that, at 24hpf, foxj1a is expressed throughout the kidney ducts (C). Its expression was not affected in the gmnc MO-injected Tg(0.6foxj1a::GFP) embryos (100%, n=10) (D). GFP (foxj1a; green), DAPI (blue). Scale bars: 10µm. |
|
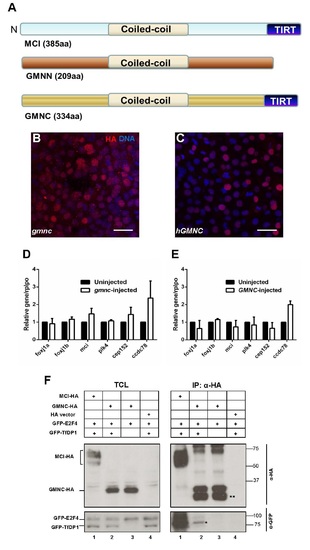
Schematic of the conserved domains among MCIDAS, GMNN and GMNC, nuclear localization of the zebrafish and human GMNC proteins, the lack of overt transcription activation properties of zebrafish and human GMNC proteins, and the lack of interaction between human GMNC and E2F4/TfDP1 (A) The human MCIDAS, GMNN and GMNC proteins all include a coiled-coil domain. A conserved C-terminus region called the TIRT-domain is present in the MCIDAS and GMNC proteins, but absent in GMNN. (B and C) In vitro transcribed zebrafish gmnc-HA RNA (encoding Gmnc protein tagged C-terminally with the haemagglutinin (HA) epitope) (B) or human GMNC-HA RNA (C) were injected into one-cell zebrafish embryos. At 7hpf, embryos displayed mosaic expression of the HA-tagged proteins, with nuclear localization. HA (red), DAPI (blue). Scale bars: 10µm. (D and E) Quantitative qPCRs were performed on zebrafish gmnc-HA (D) or human GMNC-HA (E) RNA-injected embryos at 24 hpf. The ciliogenic genes investigated include foxj1a, foxj1b, mcidas (mci), plk4, cep152 and ccdc78. Expression levels in the uninjected condition were arbitrarily assigned a value of 1. rplpo was used as an internal (loading) control. Error bars represent SEM from 3 (D) or 2 (E) independent experiments. (F) HA-tagged GMNC (GMNC-HA) was co-transfected in HEK-293T cells with GFP-tagged E2F4 (GFP-E2F4) alone (TCL panel, lane 3) or in the presence of its dimerization partner GFP-TfDP1 (TCL panel, lane 2). Empty HA vector (TCL panel, lane 4) and HAtagged MULTICILIN (MCI-HA) (TCL panel, lane 1) were used as negative and positive controls, respectively. Immunoprecipitation using a monoclonal HA antibody pulled down the MCI-HA and GMNC-HA proteins (IP panel, anti-HA blot). The lower bands (double asterisks) could be degradation products of the GMNC-HA protein. GFP-E2F4/TfDP1 co-immunoprecipitated only with MCI-HA (IP panel, anti-GFP blot, lane 1), but not with GMNC-HA (IP panel, anti-GFP blot, lane 2). The faint band (asterisk) is likely a non-specific species. TCL: Total cell lysate. IP: Immuno-precipitation. The western blot images are representative of the 2 independent experiments performed. |

