
- Title
-
Dachsous1b cadherin regulates actin and microtubule cytoskeleton during early zebrafish embryogenesis
- Authors
- Li-Villarreal, N., Forbes, M.M., Loza, A.J., Chen, J., Ma, T., Helde, K., Moens, C.B., Shin, J., Sawada, A., Hindes, A.E., Dubrulle, J., Schier, A.F., Longmore, G.D., Marlow, F.L., Solnica-Krezel, L.
- Source
- Full text @ Development
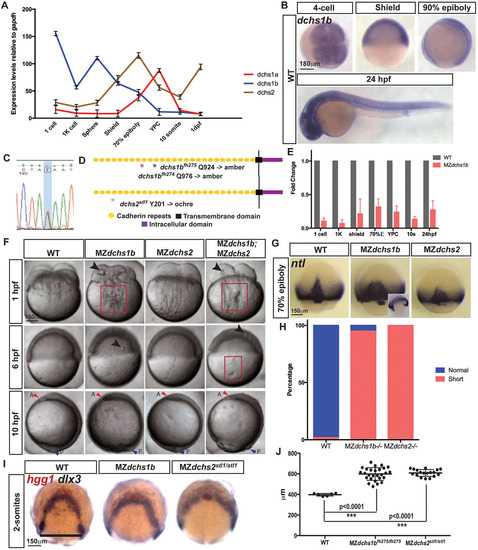
Spatiotemporal expression and mutations in zebrafish dchs genes leading to pleiotropic defects during embryogenesis. (A) qRT-PCR analysis of the expression of all three zebrafish dchs genes at maternal and zygotic stages normalized to gapdh transcripts. (B) Whole-mount in situ hybridization (WISH) of dchs1b in WT embryos at four-cell, shield, 90% epiboly and 24-hpf stages. (C) Sanger sequencing trace for dchs2 A-to-T mutations. (D) Schematic of Dchs protein, with mutations denoted by asterisks. (E) qRT-PCR analysis of dchs1b expression in MZdchs1b relative to WT embryos at maternal and zygotic stages. (F) Bright-field images of WT, MZdchs1b, MZdchs2stl1/stl1 and MZdchs1bfh275/fh275;MZdchs2stl1/stl1 time-matched embryos at 1, 6 and 10hpf. Red boxes indicate distortions in the yolk cell. Large arrowheads denote yolk masses in the blastoderm. Small red arrowheads indicate anterior (A); small blue arrowheads indicate posterior (P). (G) ntl WISH for stage-matched WT, MZdchs1b and MZdchs2stl1/stl1 embryos at 70% epiboly. Inset depicts time-matched MZdchs1b embryo with a gap in the ntl expression domain. (H) Quantification of axial mesoderm length in WT (n=111), MZdchs1b (n=414) and MZdchs2stl1/stl1 (n=486) embryos. (I) hgg1 and dlx3 WISH analysis of WT, MZdchs1b and MZdchs2stl1/stl1 stage-matched embryos at two-somite stage (12hpf). (J) Quantification of the mediolateral width of dlx3 domain for WT (n=6), MZdchs1b (n=27) and MZdchs2stl1/stl1 (n=18), shown by black line. |
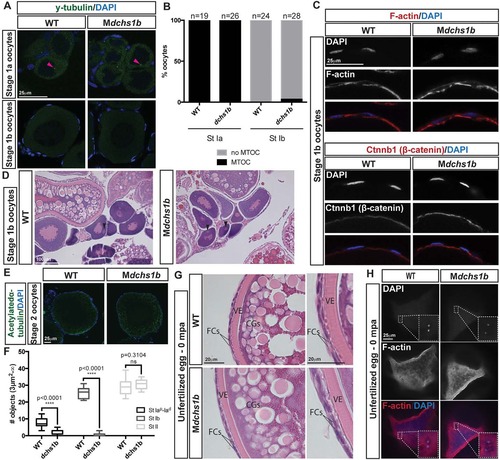
dchs1b oogenesis is largely unaffected. (A) γ-tubulin immunostaining reveals a perinuclear MTOC (pink arrowhead) in the stage Ia oocyte that is lost during stage Ib of oogenesis in WT and dchs1b mutants. (B) Quantification of MTOC in oocytes from two WT and three mutant ovaries. (C) Rhodamine Phalloidin labels actin filaments in the cortical ooplasm and in the follicle cell layer. β-catenin localizes to the oocyte cortex or membrane in stage Ib oocytes. (D) H&E-stained ovary sections of WT and Mdchs1b ovaries reveal normal polarization of stage Ib oocytes as indicated by the presence of the Balbiani body (black arrowheads). (E) WT and Mdchs1b mutant stage II oocytes stained with antibody against acetylated α-tubulin. (F) Quantification of acetylated microtubules from five WT and seven mutant ovaries. (G) H&E-stained ovary sections reveal cortical granule movement toward the cortex, structure of the vitelline envelope (VE) and the two layers of somatic follicle cells surrounding stage III oocytes of WT and Mdchs1b mutants. CGs, cortical granules; FCs, follicle cells. (H) F-actin labeling of polar bodies in unfertilized eggs fixed at 0 mpa, with completion of meiosis indicated by the appearance of the polar body and the pronucleus from WT and Mdchs1b mutant eggs. |
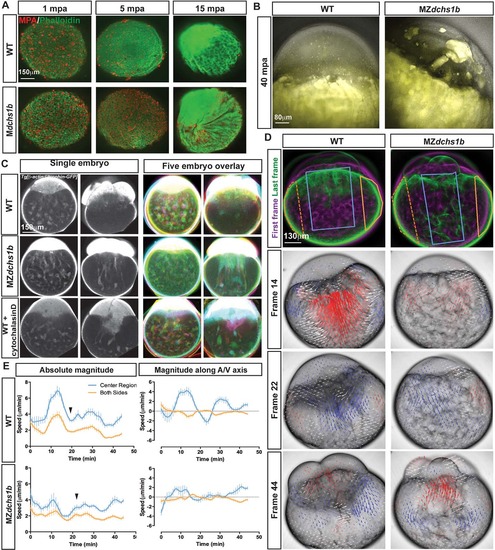
Egg activation defects in MZdchs1b and cytochalasin D-treated WT embryos. (A) Maximum z-projection of phalloidin (green) and MPA (red) staining of activated WT and M or MZdchs1b eggs fixed at 1, 5 and 15mpa. (B) Overlay of bright-field and auto-fluorescent maximum z-projections of WT, MZdchs1b eggs at 40mpa. (C) Single z-plane images from time-lapse movies of single embryos in grayscale, and overlay of five pseudo-colored WT Tg[β-actin:Utrophin-GFP], MZdchs1b;Tg[β-actin:Utrophin-GFP] and WT Tg[β-actin:Utrophin-GFP] +3µg/ml cytochalasin D-treated embryos at 15mpf and 75mpf. (D) Maximum z-projection images from time-lapse movies of WT, and MZdchs1b embryos in bright-field at frames 14, 22 and 44 with PIV analysis overlaid. PIV analysis: red arrows, towards the animal pole; blue arrows, towards the vegetal pole; arrow length indicates movement magnitude. Leftmost panels: pseudo-colored first frame (magenta) and last frame (green) overlaid. (E) Quantification of cytoplasmic movement with PIV for WT (n=8) and MZdchs1b (n=9) embryos. Blue lines represent center of embryos marked by blue boxes in left panels in D, and orange lines represent both edges of embryos demarcated by orange crescent boxes in D. Left graphs show magnitude of motion and right graphs show magnitude of motion with respect to embryonic A/V axis. Graphs are plotted with s.d. bars. |
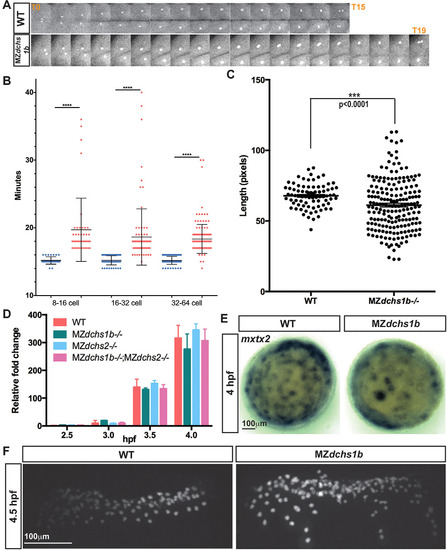
Uncoupling of cell division and MBT in MZdchs1b mutants. (A) One-cell division from early anaphase to the next early anaphase in WT and MZdchs1b blastula-stage embryos. (B) Quantification of length of cell divisions in WT (blue) and MZdchs1b (red) embryos. (C) Quantification of length of the longest cell axis in 128-cell-stage WT and MZdchs1b embryos. (D) Zygotic expression of boz in MZdchs1b, MZdchs2stl1/stl1 and MZdchs1bfh275/fh275;MZdchs2stl1/stl1 mutants compared with WT relative to MBT. (E) mxtx2 WISH in time-matched WT and MZdchs1b embryos, labeling YSN at 4hpf; animal-pole view. (F) H2B-GFP labeling of YSN in WT and MZdchs1b embryos. |
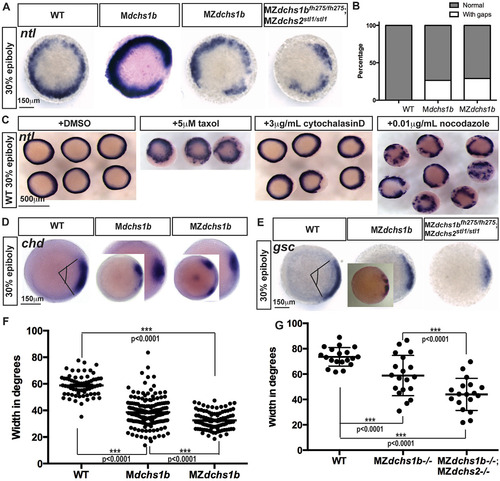
Mesoderm specification is deficient in MZdchs1b embryos and WT embryos with impaired cytoskeleton. (A) ntl expression in MZdchs1b, Mdchs1b and MZdchs1bfh275/fh275;MZdchs2stl1/stl1stage-matched embryos at 30% epiboly; animal-pole view. (B) Quantification of gaps in ntl expression in WT, Mdchs1b and MZdchs1b embryos. (C) ntl expression in WT embryos treated with DMSO, 5µM taxol, 3µg/ml cytochalasin D and 0.01µg/ml nocodazole at 30% epiboly; animal-pole view. (D) chd expression domain in WT, Mdchs1b and MZdchs1b embryos. Insets show embryos with gap in expression domain. (E) gsc expression in WT, MZdchs1b, MZdchs2stl1/stl1 and MZdchs1bfh275/fh275;MZdchs2stl1/stl1 stage-matched embryos at 30% epiboly; animal-pole view. Inset in MZdchs1b panel shows representative image of disrupted gsc domain. (F) Measurement of the chd expression domain in degrees for embryos shown in D. (G) Measurement of the gsc expression domain in degrees for embryos shown in E. EXPRESSION / LABELING:
PHENOTYPE:
|
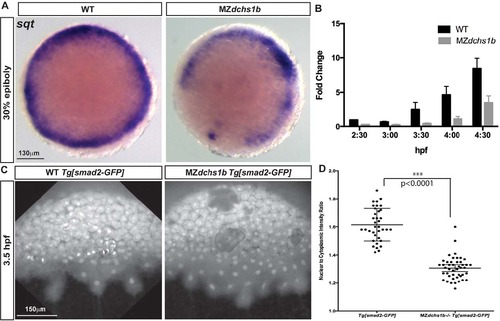
Reduced Nodal signaling in MZdchs1b embryos. (A) sqt expression in stage-matched WT and MZdchs1b embryos; animal-pole view. (B) Quantitative RT-PCR of sqt RNA in time-matched WT and MZdchs1b embryos during MBT. (C) Max z-projection of time-matched WT Tg[smad2-GFP] and MZdchs1b;Tg[smad2-GFP] embryos at 3.5hpf. (D) Quantification of nuclear-to-cytoplasm ratio for GFP intensity in WT Tg[smad2-GFP] and MZdchs1b;Tg[smad2-GFP] embryos shown in C. EXPRESSION / LABELING:
PHENOTYPE:
|
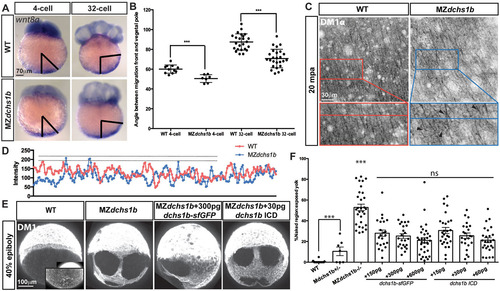
Abnormal wnt8 expression-domain shift and vegetal microtubule populations in MZdchs1b mutants, and dchs1b RNA rescue of the microtubule phenotype. (A) wnt8a expression in WT and MZdchs1b embryos at four- and 32-cell stages. Black bars mark the angle between the edge of wnt8a expression domain from the vegetal pole. (B) Quantification of the angle between the edge of the wnt8a expression domain and the vegetal pole for WT and MZdchs1b embryos at four- and 32-cell stages. ***P<0.005. (C) DM1α labeling of vegetal-pole microtubules for WT and MZdchs1b embryos at 20mpa. Top panels show parallel microtubule arrays in tangential view of embryos. Bottom panels show higher magnification views, with black arrowheads indicating crossing microtubules. (D) Plot profile of WT and MZdchs1b parallel arrays for intensity. (E) DM1α labeling of microtubules in WT, MZdchs1b and MZdchs1b embryos injected with dchs1b full-length RNA and ICD RNA at 40% epiboly. (F) Quantification of rescue-of-yolk microtubule phenotype, with different doses of dchs1b full-length or ICD RNAs. MZdchs1b is statistically different from all other conditions. ns, not significant; ***P<0.0001. EXPRESSION / LABELING:
|
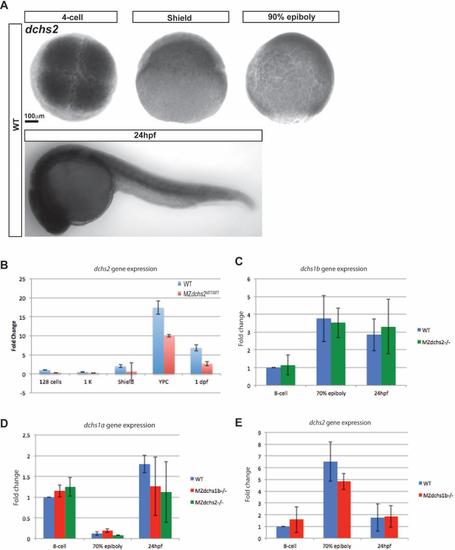
dchs expression in zebrafish A. Whole-mount in situ hybridization of dchs2 in WT embryos at 4-cell (1 hpf), shield (6 hpf), 90% epiboly (9 hpf), and 24 hpf stages. B. Quantitative RT-PCR analysis of dchs2 expression levels in MZdchs2stl1/stl1 mutants relative to WT embryos at maternal and zygotic stages. C. Relative expression by qRT-PCR of dchs1b in WT and MZdchs1bstl1/stl1 embryos. D. Relative expression by qRT-PCR of dchs1a in WT, MZdchs1bfh275/fh275, and MZdchs1bstl1/stl1 embryos. E. Relative expression by qRT-PCR of dchs2 in WT and MZdchs1bfh275/fh275 embryos. |
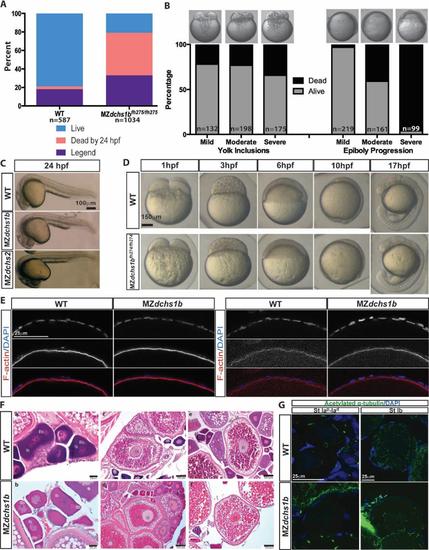
Survival, morphology, and histology of WT and dchs mutants A. Survival and fertility for WT (n=587) and MZdchs1bfh275/fh275 (n= 1034) mutant embryos. B. Survival of MZdchs1bfh275/fh275 embryos based on severity of yolk inclusions and delayed epiboly phenotypes. C. Morphology of WT, MZdchs1bfh275/fh275, and MZdchs1bstl1/stl1 embryos at 24 hpf. D. Bright field images of WT and MZdchs1bfh27/fh274 time matched embryos at 1, 3, 6, 10, and 17 hpf. E. Rhodamine phalloidin labels actin filaments in the cortical ooplasm and in the follicle cell layer. β-catenin localizes to the oocyte cortex or membrane in stage II oocytes of WT and dchs1b mutants. F. Hematoxylin and Eosin (H&E) stained ovary sections of WT and maternal dachsous mutant ovaries reveal a normal composition of oocytes. The primary oocytes of WT and Mdchs mutant ovaries are polarized as indicated by the presence of the Balbiani body (Bb) in stage Ib oocytes. Cortical granules begin to accumulate in stage II (II) oocytes of WT and Mdchs mutants and localize to the cortex in stage III (III) oocytes, which are distinguishable by the presence of yolk granules (Ygs). The structure of the vitelline envelope (VE) surrounding the oocyte is indistinguishable between WT and mutants. Images are representative of oocytes from 3 WT and 3 mutant females examined. G. WT and dchs1b mutant oocytes stained with an antibody against acetylated α-tubulin. |
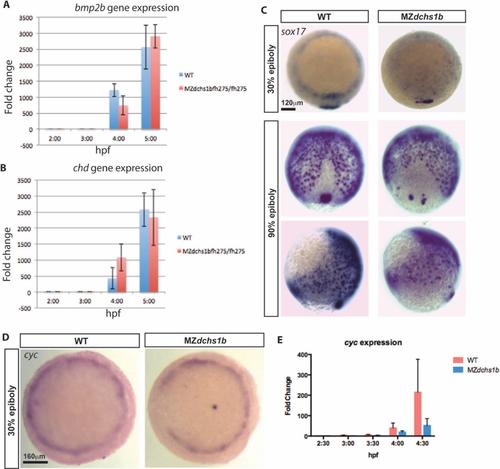
Levels and patterns of zygotic gene expression. A. Expression of zygotic gene bmp2b in WT and MZdchs1b embryos during MBT by qRT-PCR. B. Expression of zygotic gene chd in WT and MZdchs1b embryos during MBT by qRT-PCR. C. Expression of sox17 revealed by WISH in stage matched WT andMZdchs1b embryos at 30% and 90% epiboly. Animal pole view for 30% epiboly embryos. Dorsal and later views for 90% epiboly embryos. D. cyc WISH of stage matched WT and MZdchs1b embryos; animal pole view. E. Quantitative RT-PCR of cyc for time matched WT and MZdchs1b embryos during MBT. |
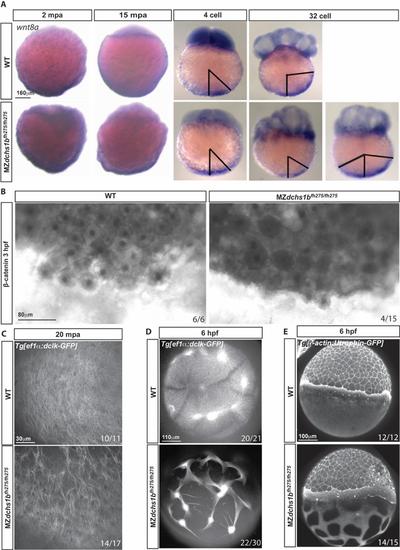
wnt8a transport and the cytoskeleton. A. wnt8a transcripts detected by WISH in WT and MZdchs1bfh275/fh275 embryos at 2 mpa, 15 mpa, 4 and 32 cell stages. Representative patterns of wnt8a RNA expression domain in MZdchs1bfh275/fh275 embryos at 32-cell stage. Black bars mark the angle of the edge of the wnt8a RNA expression domain from the vegetal pole. B. β-catenin labeling in 3 hpf WT and MZdchs1bfh275/fh275 embryos. C. Max z-projection of parallel array microtubule at 20 mpa in WT and MZdchs1bfh275/fh275 embryos. D. Max z-projection of vegetal pole microtubule at 6 hpf in WT and MZdchs1bfh275/fh275 embryos. E. Max z-projection of lateral view actin at 6 hpf in WT and MZdchs1bfh275/fh275 embryos. |
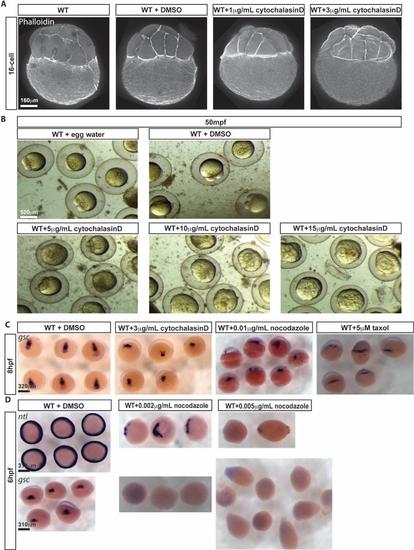
WT embryos treated with cytoskeleton altering agents. A. Phalloidin labeling of F-actin at 16-cell stage for WT, WT treated with DMSO, WT treated with 1µg/mL cytochalasinD, and WT treated with 3µg/mL cytochalasinD from activation. B. Bright field images of WT in vitro fertilized embryos in egg water, DMSO, 5µg/mL cytochalasinD, 10µg/mL cytochalasinD, and 15µg/mL cytochalasinD from activation at 50mpf. C. gsc transcripts revealed by WISH in WT embryos treated at 1 hpf with DMSO, 3µg/mL cytochalasinD, 0.01µg/mL nocodazole, and 5µM taxol at 8 hpf; dorsal view. D. ntl and gsc transcripts revealed by WISH in WT embryos treated at 1 hpf with DMSO, 0.002µg/mL nocodazole, and 0.005µg/mL nocodazole; 6 hpf animal pole view. |