
Fig. 3
- ID
- ZDB-IMAGE-151009-48
- Genes
- Publication
- Li-Villarreal et al., 2015 - Dachsous1b cadherin regulates actin and microtubule cytoskeleton during early zebrafish embryogenesis
- All Figures
- Figures for Li-Villarreal et al., 2015
|
Fig. 3
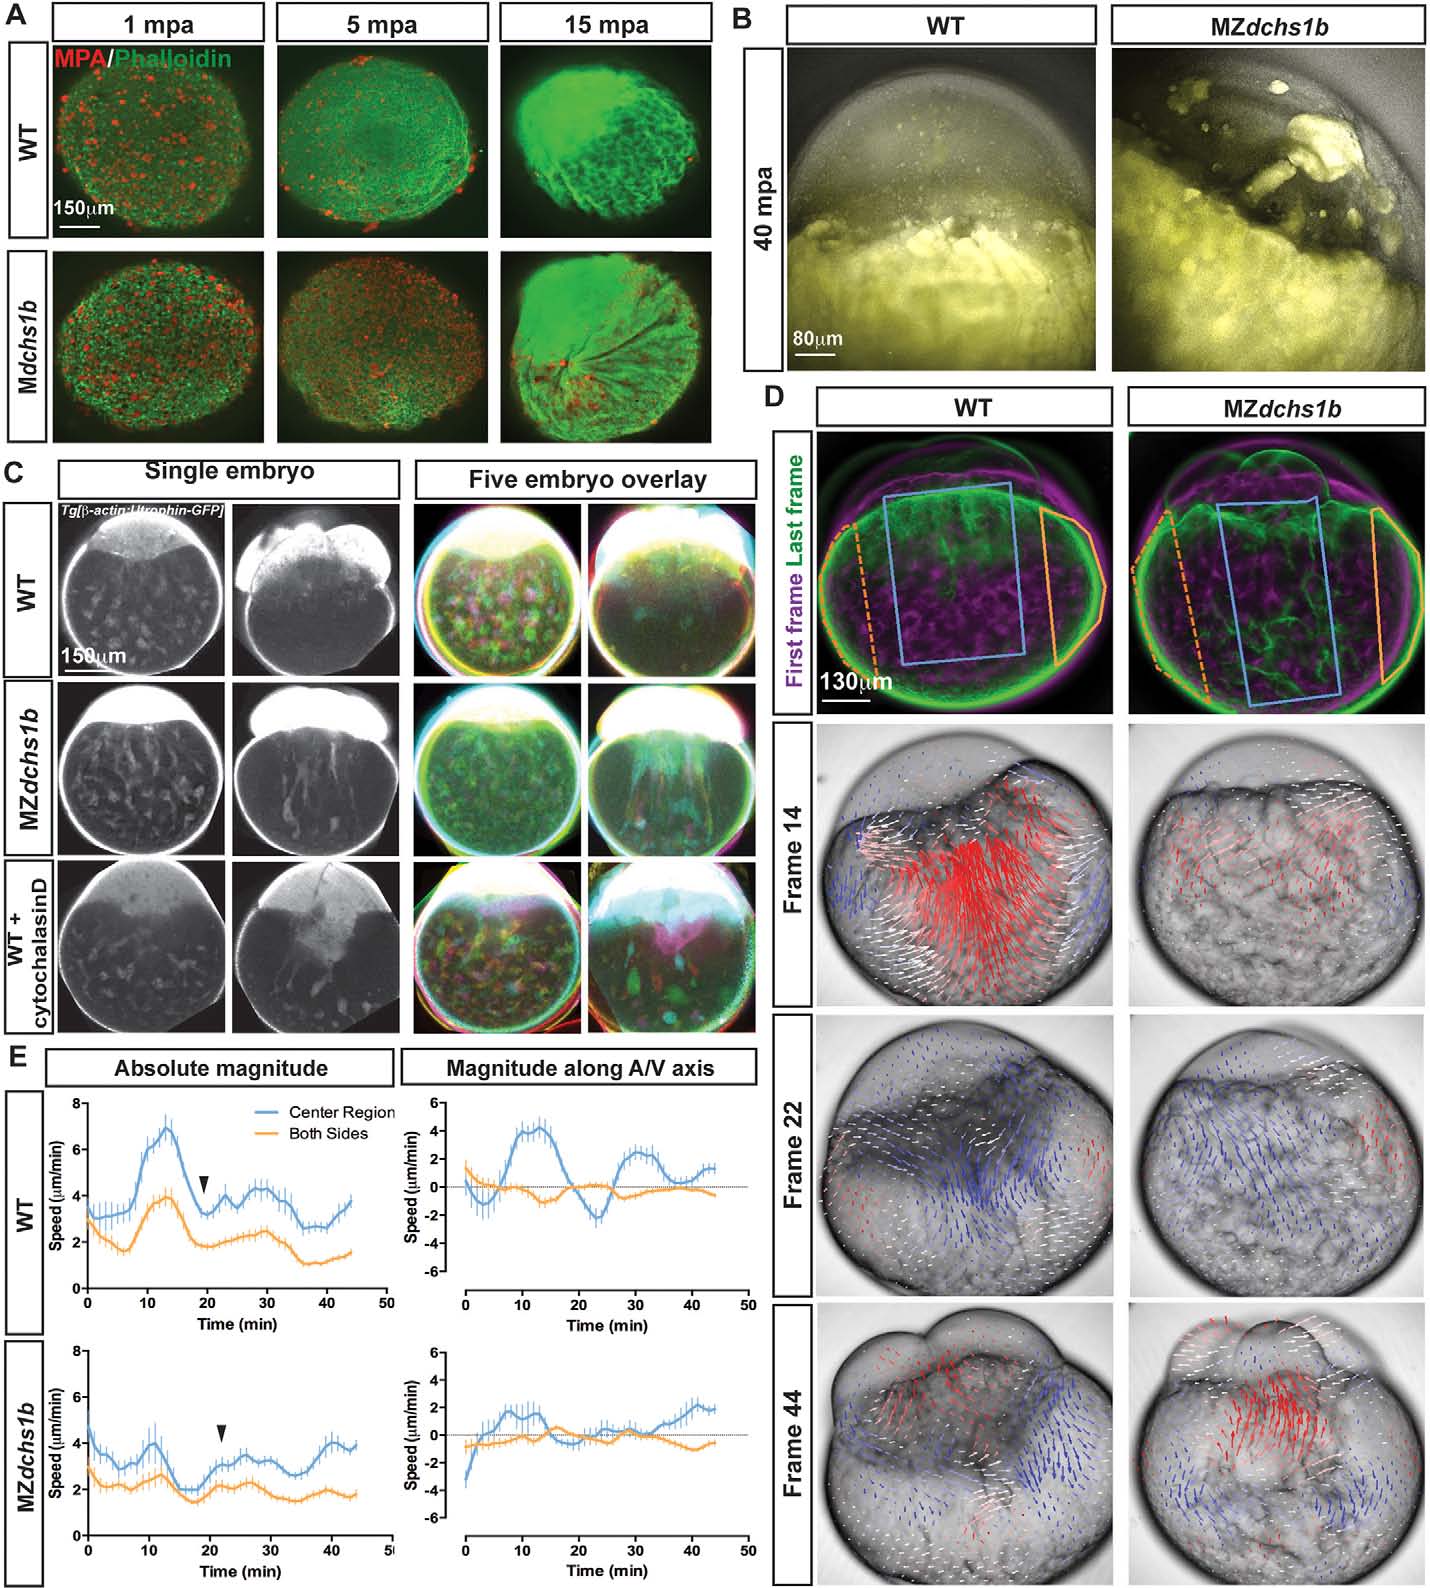
Egg activation defects in MZdchs1b and cytochalasin D-treated WT embryos. (A) Maximum z-projection of phalloidin (green) and MPA (red) staining of activated WT and M or MZdchs1b eggs fixed at 1, 5 and 15mpa. (B) Overlay of bright-field and auto-fluorescent maximum z-projections of WT, MZdchs1b eggs at 40mpa. (C) Single z-plane images from time-lapse movies of single embryos in grayscale, and overlay of five pseudo-colored WT Tg[β-actin:Utrophin-GFP], MZdchs1b;Tg[β-actin:Utrophin-GFP] and WT Tg[β-actin:Utrophin-GFP] +3µg/ml cytochalasin D-treated embryos at 15mpf and 75mpf. (D) Maximum z-projection images from time-lapse movies of WT, and MZdchs1b embryos in bright-field at frames 14, 22 and 44 with PIV analysis overlaid. PIV analysis: red arrows, towards the animal pole; blue arrows, towards the vegetal pole; arrow length indicates movement magnitude. Leftmost panels: pseudo-colored first frame (magenta) and last frame (green) overlaid. (E) Quantification of cytoplasmic movement with PIV for WT (n=8) and MZdchs1b (n=9) embryos. Blue lines represent center of embryos marked by blue boxes in left panels in D, and orange lines represent both edges of embryos demarcated by orange crescent boxes in D. Left graphs show magnitude of motion and right graphs show magnitude of motion with respect to embryonic A/V axis. Graphs are plotted with s.d. bars.