
- Title
-
Granulin Knock Out Zebrafish Lack Frontotemporal Lobar Degeneration and Neuronal Ceroid Lipofuscinosis Pathology
- Authors
- Solchenberger, B., Russell, C., Kremmer, E., Haass, C., Schmid, B.
- Source
- Full text @ PLoS One
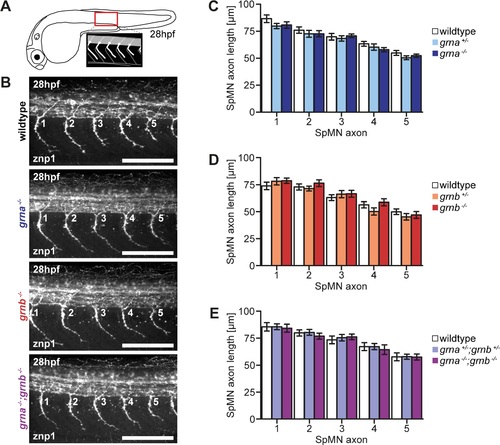
No SpMN axonopathy in Grna and Grnb single and double KOs. A: Schematic illustration of a zebrafish embryo at 28hpf (lateral view) and a detail of the region above the end of the yolk extension imaged for the analysis of SpMN axons (lateral view). B: In Grna and Grnb single and double KOs the SpMN axons show no extended branching. Whole-mount immunofluorescence staining of 28hpf embryos with znp1 antibody. The 5 SpMN axons above the end of the yolk extension are shown. Images taken by spinning disk confocal microscopy. Anterior to the left. Lateral view. Orthogonal projections. Scale bar: 100µm. C-E: Quantification of the SpMN axon length in homozygous and heterozygous Grna and Grnb single and double KOs and wildtype siblings. The SpMN axon length of the 5 SpMN axons (1–5) above the end of the yolk extension is measured from the exit point of the spinal cord to the tip of the growth cone. C: Homozygous and heterozygous Grna KOs and wildtype siblings. n = 30. D: Homozygous and heterozygous Grnb KOs and wildtype siblings. n = 30. E: Homozygous and heterozygous Grna and Grnb KOs and wildtype siblings. n = 25. S.E.M. Two-way ANOVA. Bonferroni post-test. All non-significant (n.s.). |
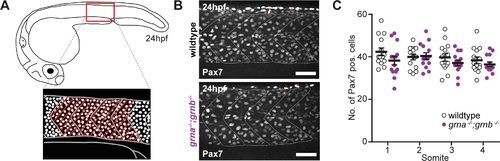
The number of MPCs is equal. A: Schematic illustration of a zebrafish embryo at 24hpf (lateral view) and a detail of the region above the end of the yolk extension imaged for the analysis of the MPCs (lateral view). The four somites, which were considered for the quantification of MPCs are marked with red lines. B: Immunofluorescence staining with Pax7 at 24hpf in grna-/-;grnb-/- mutants and wildtype embryos. In each image two xanthophores are exemplarily marked with a red x. Images taken by spinning disk confocal microscopy. Anterior to the left. Lateral view. Orthogonal projections. Scale bar: 50µm. C: Quantification of Pax7-positive cells in the 4 somites (1–4) above the end of the yolk extension in grna-/-;grnb-/- mutants and wildtype embryos. Only Pax7-positive cells at the surface of the somites were counted. n = 15. S.E.M. Mann-Whitney test (two-tailed). All n.s. S1: p = 0.0854. S2: p = 0.7977. S3: p = 0.3489. S4: p = 0.2337. |
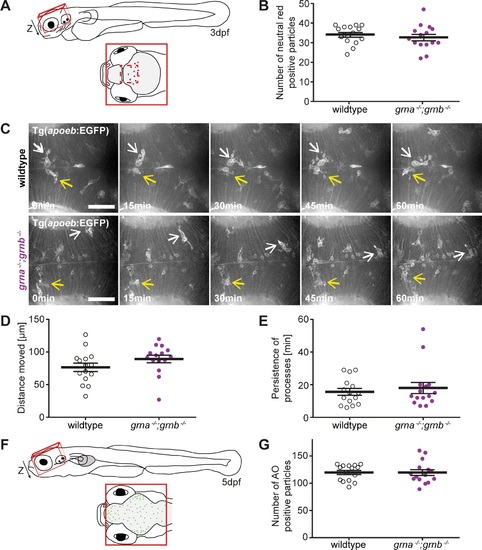
No microgliosis and neurodegeneration in grna-/-;grnb-/- mutants. A: Schematic illustration of a zebrafish larvae at 3dpf (lateral view) and a detail of the region (red line), dorsal view, imaged for the analysis of neutral red positive particles (B). The dashed red line marks the area that was imaged in the time lapse recordings of microglia (C). B: The number of neutral red positive particle in the region illustrated in A (Z-stack) is unchanged in wildtype and grna-/-;grnb-/- mutants. n = 15. S.E.M. Mann-Whitney test (two-tailed). p = 0.2884. C-E: Microglia in Tg(apoeb:lynEGFP) grna-/-;grnb-/- mutants and wildtype larvae at 3dpf are indistinguishable. C: Still images of the time lapse recordings in the optic tectum recorded by spinning disk confocal microscopy. Two microglia cells marked in each genotype by a white and yellow arrow. Dorsal view. Anterior to the left. n = 3. Scale bar: 50µm. Recording time: 60min. 1frame/min. D: The distance microglia move within one hour in grna-/-;grnb-/- mutants and wildtype larvae. Quantification of n = 3x5 randomly selected microglia from the time lapse recordings shown in C. S.E.M. Mann-Whitney test (two-tailed). p = 0.0671. E: Processes in the grna-/-;grnb-/- mutants and wildtype larvae persist for same durations. Quantification of n = 3x5 randomly selected processes from the time lapse recordings shown in C. S.E.M. Mann-Whitney test (two-tailed). p = 0.8296. F: Schematic illustration of a zebrafish larvae at 5dpf (lateral view) and a detail of the region, dorsal view, imaged for the analysis of acridine orange (AO) positive cells. G: The number of acridine orange positive cells in the region illustrated in C (Z-stack) is unchanged in wildtype and grna-/-;grnb-/- mutants. n = 15. S.E.M. Mann-Whitney test (two-tailed). p = 0.69. |
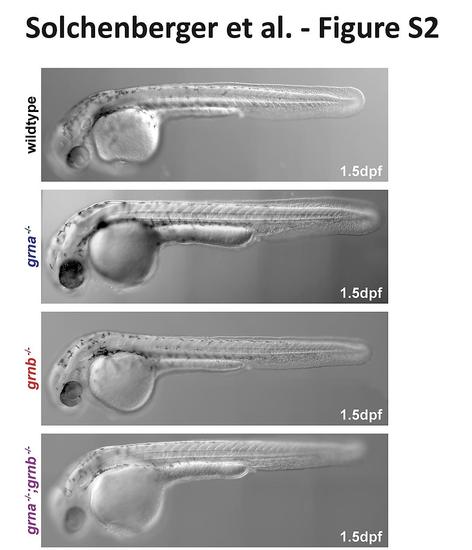
Grna and Grnb single and double KOs have no obvious morphological phenotype. Images of 1.5dpf old wildtype, Grna and Grnb single and double KOs. Anterior to the left. Lateral view. Single images were taken on a spinning disk microscope using transmitted light and were stitched using the Image Stitching plugin of ImageJ. |