
|
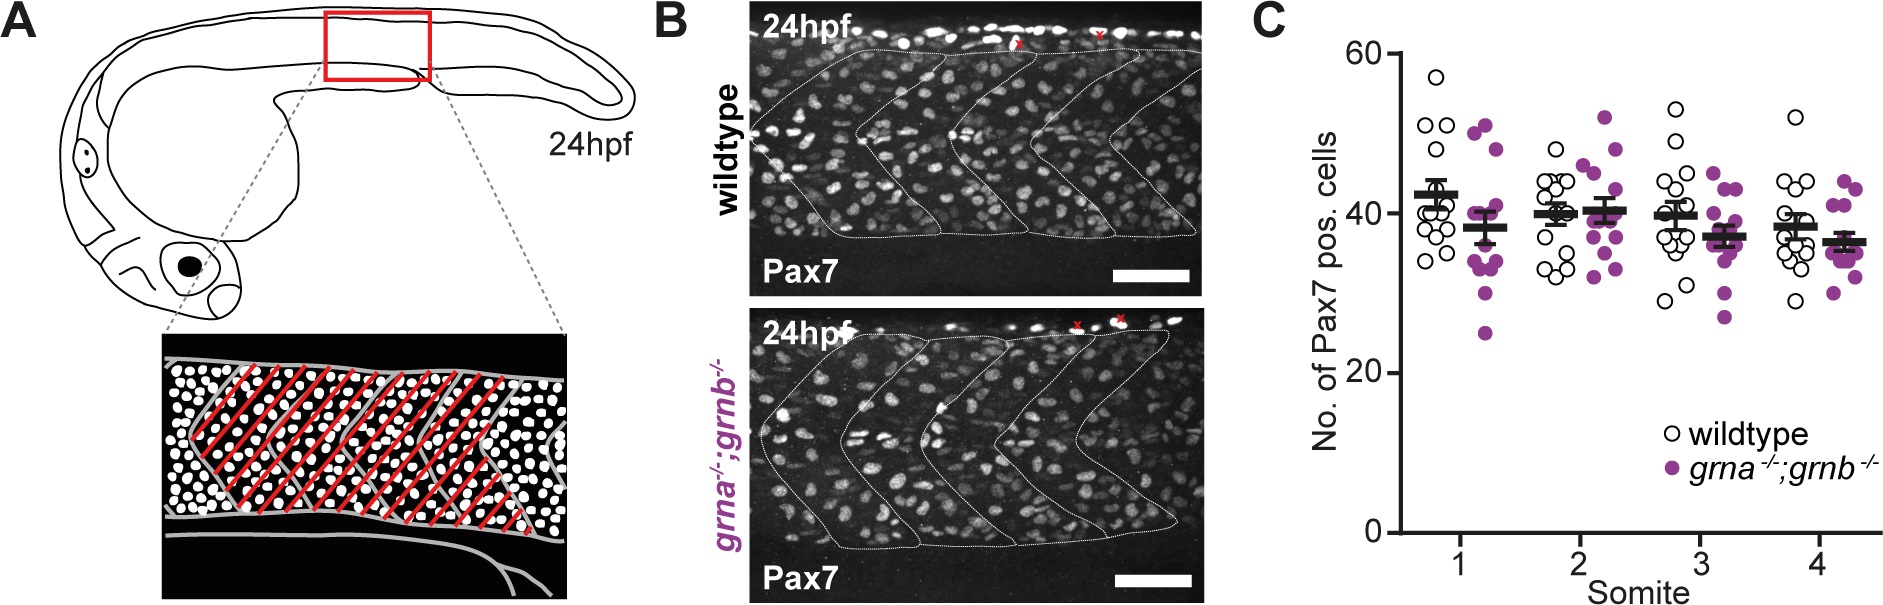
Fig. 3 The number of MPCs is equal.
A: Schematic illustration of a zebrafish embryo at 24hpf (lateral view) and a detail of the region above the end of the yolk extension imaged for the analysis of the MPCs (lateral view). The four somites, which were considered for the quantification of MPCs are marked with red lines. B: Immunofluorescence staining with Pax7 at 24hpf in grna-/-;grnb-/- mutants and wildtype embryos. In each image two xanthophores are exemplarily marked with a red x. Images taken by spinning disk confocal microscopy. Anterior to the left. Lateral view. Orthogonal projections. Scale bar: 50µm. C: Quantification of Pax7-positive cells in the 4 somites (1–4) above the end of the yolk extension in grna-/-;grnb-/- mutants and wildtype embryos. Only Pax7-positive cells at the surface of the somites were counted. n = 15. S.E.M. Mann-Whitney test (two-tailed). All n.s. S1: p = 0.0854. S2: p = 0.7977. S3: p = 0.3489. S4: p = 0.2337.