- Title
-
Integrative Analysis of Circadian Transcriptome and Metabolic Network Reveals the Role of De Novo Purine Synthesis in Circadian Control of Cell Cycle
- Authors
- Li, Y., Li, G., Görling, B., Luy, B., Du, J., Yan, J.
- Source
- Full text @ PLoS Comput. Biol.
|
The circadian expression of three impdh homologs show robust in larvae and adult zebrafish tissues. The expression of impdh1a (A) is not circadian oscillating in adult zebrafish brain (red line) but shows circadian rhythm in 5dpf larval whole body (black line). impdh1b (B) and impdh2 (C) are circadian oscillating with circadian phases around CT12 and CT23 respectively in both adult zebrafish brain and larvae. The solid curves represent microarray data and the dashed curves were fitted by cosine functions. (D) impdh1a is predominantly expressed in the adult eye where the expression level at ZT0 is much higher than that at ZT12. (E) impdh1b shows rhythmic expression in the brain, eye, heart and muscle. (F) Although the expression of impdh2 in the heart is higher than in other tissues, it shows the most significant expression change between ZT0 and ZT12 in the liver. Error bars represent the standard error of mean (SEM) among independent biological replicates. The gene expression levels at ZT0 and ZT12 were compared using a Student’s t-test (unpaired, two tailed; *** p<0.001; ** p<0.01; * p<0.05). |
|
impdh1a knock-down leads to pigmentation defects and smaller eyes. (A,D,G,J,M): Coronal planes through 5 dpf larval eyes. Xanthophores (yellow arrow) and iridophores (red arrow) were reduced significantly in impdh1a morphants. (B,E,H,K,N): Transverse histological sections of impdh morphants. The eye length along the dorsal/ventral axis was much shorter in impdh1a morphants. There was no apparent phenotype in retinal cell types between WT, control and the three impdh morphants; (C,F,I,L,O): Dorsal images of 5 dpf larvae showed that melanophores (black arrow) covered a larger area of the head in impdh1a morphants. Anterior-posterior eye length (P) and melanocyte covered area (Q) were measured and compared using a Student’s t-test (unpaired, two tailed; *** p<0.001; ** p<0.01; * p<0.05). At least ten larvae were tested in each group. Error bars represent the standard error of mean (SEM) among independent biological replicates. GCL: ganglion cell layer, INL: inner nuclear layer, IPL: inner plexiform layer, OPL, outer plexiform layer, PR: photoreceptor layer, RPE: retinal pigment epithelium. Scale bars, 50μm. PHENOTYPE:
|
|
impdh2 mediates the circadian control of cell cycle. (A) The BrdU staining in 5 dpf larvae represents the daily rhythm of S phase in cell cycle under LD conditions. (B) The amplitude of the S phase rhythm was attenuated when the larvae were treated with MPA. The effect of MPA was rescued when guanosine was added to MPA-treated larvae. The inhibitory effect of MPA on the S phase rhythm was in a dose-dependent manner and saturated at 10μM concentration. (C) The amplitude of the S phase rhythm decreased significantly in impdh2 morphants. At least three larvae were measured at each data point. Error bars represent the standard error of mean (SEM) among independent biological replicates. Scale bars, 200μm. PHENOTYPE:
|
|
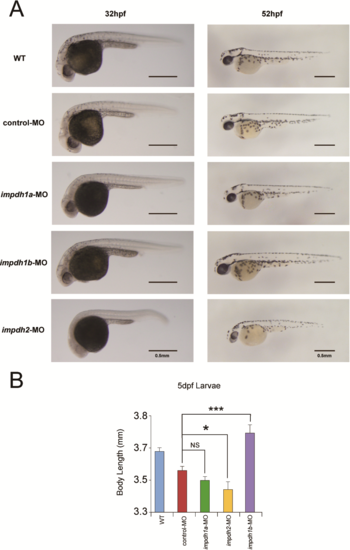
The phenotypes of WT, control morphant, and three impdh morphants at early stages of development. (A) impdh1b morphant development was faster than WT or control larvae while the impdh2 morphant grew slower at 32 hpf and 52 hpf. (B) The body lengths were calculated in 5 dpf larvae. impdh1b knock-down promotes larval zebrafish development significantly. Error bars represent the standard error of mean (SEM) among independent replicates. * p<0.05; ***P<0.001, unpaired two-tailed Student’s t-test, scale bars, 500μm. |
|
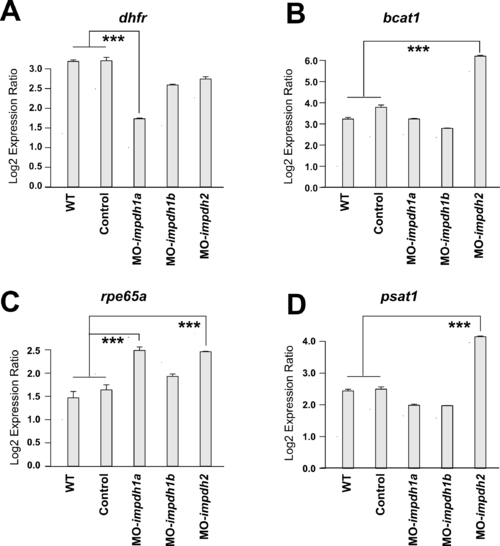
The expression of the three impdh homologs’ target genes. The differential expression of selected genes affected by the three impdh homologs knock-down: dhfr (A), bcat1 (B), rpe65a (C) and psat1 (D) have been validated by real-time PCR. Independent batches of samples from the ones used in RNA-seq were used for detection. Error bars represent the standard error of mean (SEM) among independent replicates. *** p<0.001, unpaired two-tailed Student’s t-test. EXPRESSION / LABELING:
|
|
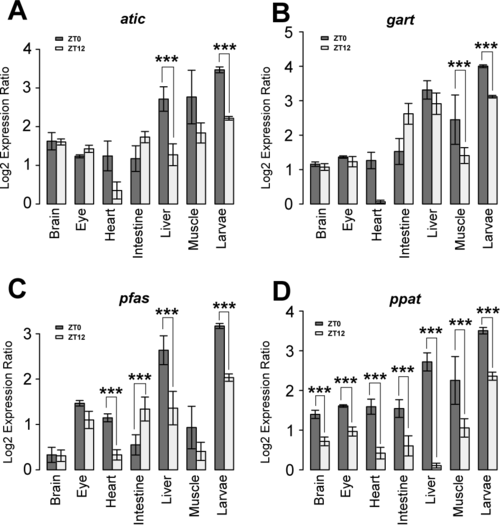
Circadian genes in the de novo purine pathway show different expression in larval and adult tissues. atic (A), gart (B), pfas (C), ppat (D) are widely rhythmically expressed in adult fish tissues. Error bars represent the standard error of mean (SEM) among independent replicates. *** p<0.001, unpaired two-tailed Student’s t-test. |


