
- Title
-
Transient Exposure to Ethanol during Zebrafish Embryogenesis Results in Defects in Neuronal Differentiation: An Alternative Model System to Study FASD
- Authors
- Joya, X., Garcia-Algar, O., Vall, O., Pujades, C.
- Source
- Full text @ PLoS One
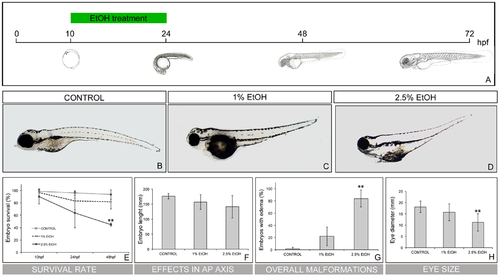
Embryos exposed to ethanol displayed increased incidence of malformations. (A) Scheme depicting the treatment conditions. Zebrafish embryos were initially exposed to 0 (control), 1 and 2.5% ethanol from 10hpf to 24hpf. The embryos were maintained until the desired stages and the phenotypes were analysed. (B-D) Phenotypic analysis of ethanol-treated embryos. Note that treatments above 1% ethanol resulted in visible malformations, namely smaller heads, smaller tails, and underdeveloped eyes. (E) Survival rate at 24 and 48hpf after ethanol-treatment. (F) Effects in embryo body length upon increasing ethanol concentrations. (G) Incidence of ethanol concentration in oedema formation. (H) Eye size analysis. ** p<0.005 vs. control group. PHENOTYPE:
|
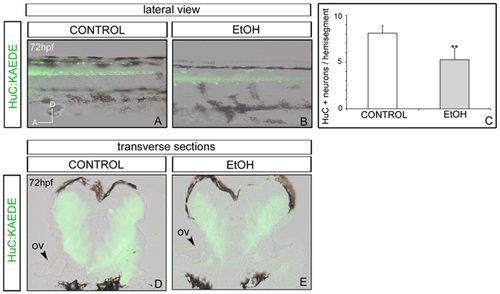
Analysis of Tg[HuC:KAEDE] embryos after ethanol exposure. Control (A,D), or ethanol-treated embryos (B,E) were analysed for neuronal differentiation. (C) Quantification of KAEDE-positive differentiated neurons per hemisegments. Note that EtOH-treated embryos have less differentiated neurons in the spinal cord. (A-B) Lateral views of 72hpf embryos with anterior to the left. (D-E) Transverse sections at the level of the hindbrain. ov; otic vesicle. ** p<0.005 vs. control group. EXPRESSION / LABELING:
|

Effects of ethanol in the population of motoneurons. Analysis of Tg[Isl1:GFP] non-exposed embryos (A-C) and ethanol-exposed (D-F). (G) Quantification of GFP-positive motoneurons in specific hemisegments and (H) measurement of axonal lenght. Note that there is not an overall change in the pattern of motoneurons or number of them in treated embryos, although axonal length is diminished. EXPRESSION / LABELING:
PHENOTYPE:
|
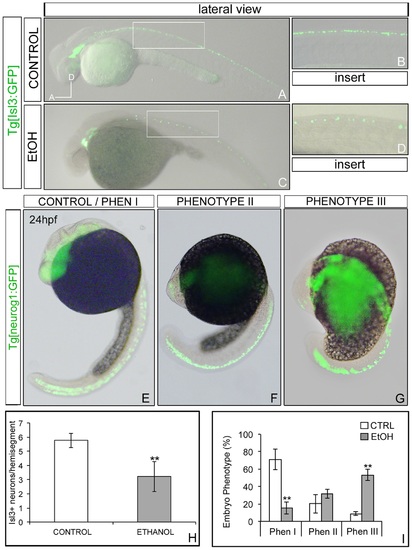
Effects of ethanol in specific neuronal populations Analysis of Tg[Isl3:GFP] non-exposed embryos (A-B) and exposed to ethanol (C-D) expressing GFP in the primary sensory neurons. (E-G) Tg[neurog1:GFP] embryos treated with ethanol display a graded phenotype: (E) Phenotype I embryos showed a normal development with high levels of GFP along the CNS, (F) Phenotype II embryos showed a delay in their development but displayed normal levels of GFP, and (G) Phenotype III, which has a very short body axis and GFP levels not grossly affected. (H) Quantification of GFP-positive sensory neurons in specific hemisegments. Note the decrease in the number of Isl3:GFP neurons per hemisegment in the ethanol-treated embryos. (I) Quantification of the penetrance of the phenotype in Tg[neurog1:GFP] embryos. ** p<0.005 vs. control group. EXPRESSION / LABELING:
PHENOTYPE:
|
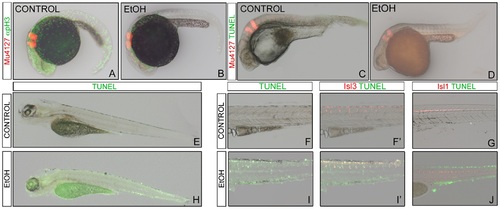
Analysis of cell proliferation and apoptotic cells in control and ethanol-treated embryos. (A-B) anti-pH3 immunofluorescence at 24hpf in order to analyse cell proliferation. (C-J) Cell death visualization using TUNEL assay in 36hpf embryos (C-D), and 5dpf larvae (E-J). Tg[Mü4127:mCherry] embryos were use for landmarks of r3 and r5 in red. (E,H) Apoptotic activity was visualized in whole-mount embryos at 5dpf. Note that ethanol-treated embryos have more apoptotic figures. (F-I) TUNEL analysis (green) in 5dpf embryos displaying red in the primary sensory neurons (F-F2, I-I2) or in motoneurons (G,J). All are lateral views with anterior to the left. |
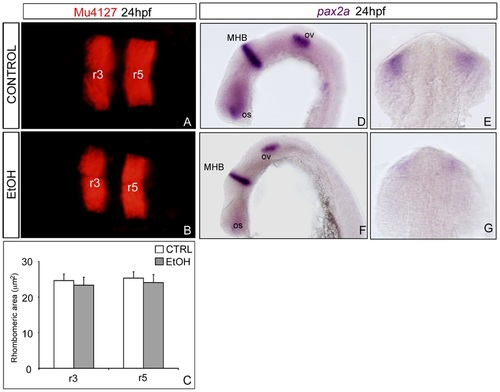
Transient ethanol exposure does not alter either hindbrain patterning or MHB formation. (A,D,E) Control and (B,F,G) ethanol-exposed embryos display no differences in expression of mCherry in r3 and r5 at 36hpf. (C) Quantification of r3 and r5 area, showing no differences upon ethanol exposure. (D-G) In situ hybridization of pax2a in 24hpf embryos. (D-E) Control and (F-G) ethanol-exposed embryos showed no differences in the expression of pax2a in the MHB and otic placode, however in the ethanol-treated embryos pax2a was downregulated in the optic stalks. Mid-Hindbrain Boundary (MHB); optic stalk (os); otic vesicle (ov). EXPRESSION / LABELING:
|