
Fig. 5
- ID
- ZDB-FIG-150216-6
- Publication
- Joya et al., 2014 - Transient Exposure to Ethanol during Zebrafish Embryogenesis Results in Defects in Neuronal Differentiation: An Alternative Model System to Study FASD
- Other Figures
- All Figure Page
- Back to All Figure Page
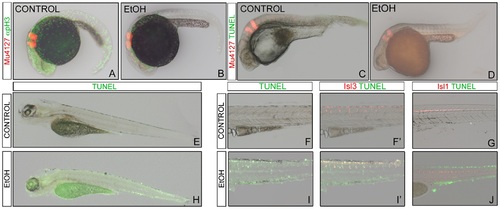
Analysis of cell proliferation and apoptotic cells in control and ethanol-treated embryos. (A-B) anti-pH3 immunofluorescence at 24hpf in order to analyse cell proliferation. (C-J) Cell death visualization using TUNEL assay in 36hpf embryos (C-D), and 5dpf larvae (E-J). Tg[Mü4127:mCherry] embryos were use for landmarks of r3 and r5 in red. (E,H) Apoptotic activity was visualized in whole-mount embryos at 5dpf. Note that ethanol-treated embryos have more apoptotic figures. (F-I) TUNEL analysis (green) in 5dpf embryos displaying red in the primary sensory neurons (F-F2, I-I2) or in motoneurons (G,J). All are lateral views with anterior to the left. |
| Genes: | |
|---|---|
| Fish: | |
| Condition: | |
| Anatomical Terms: | |
| Stage Range: | Prim-5 to Day 5 |
| Fish: | |
|---|---|
| Condition: | |
| Observed In: | |
| Stage: | Day 5 |