
Image
|
Figure Caption
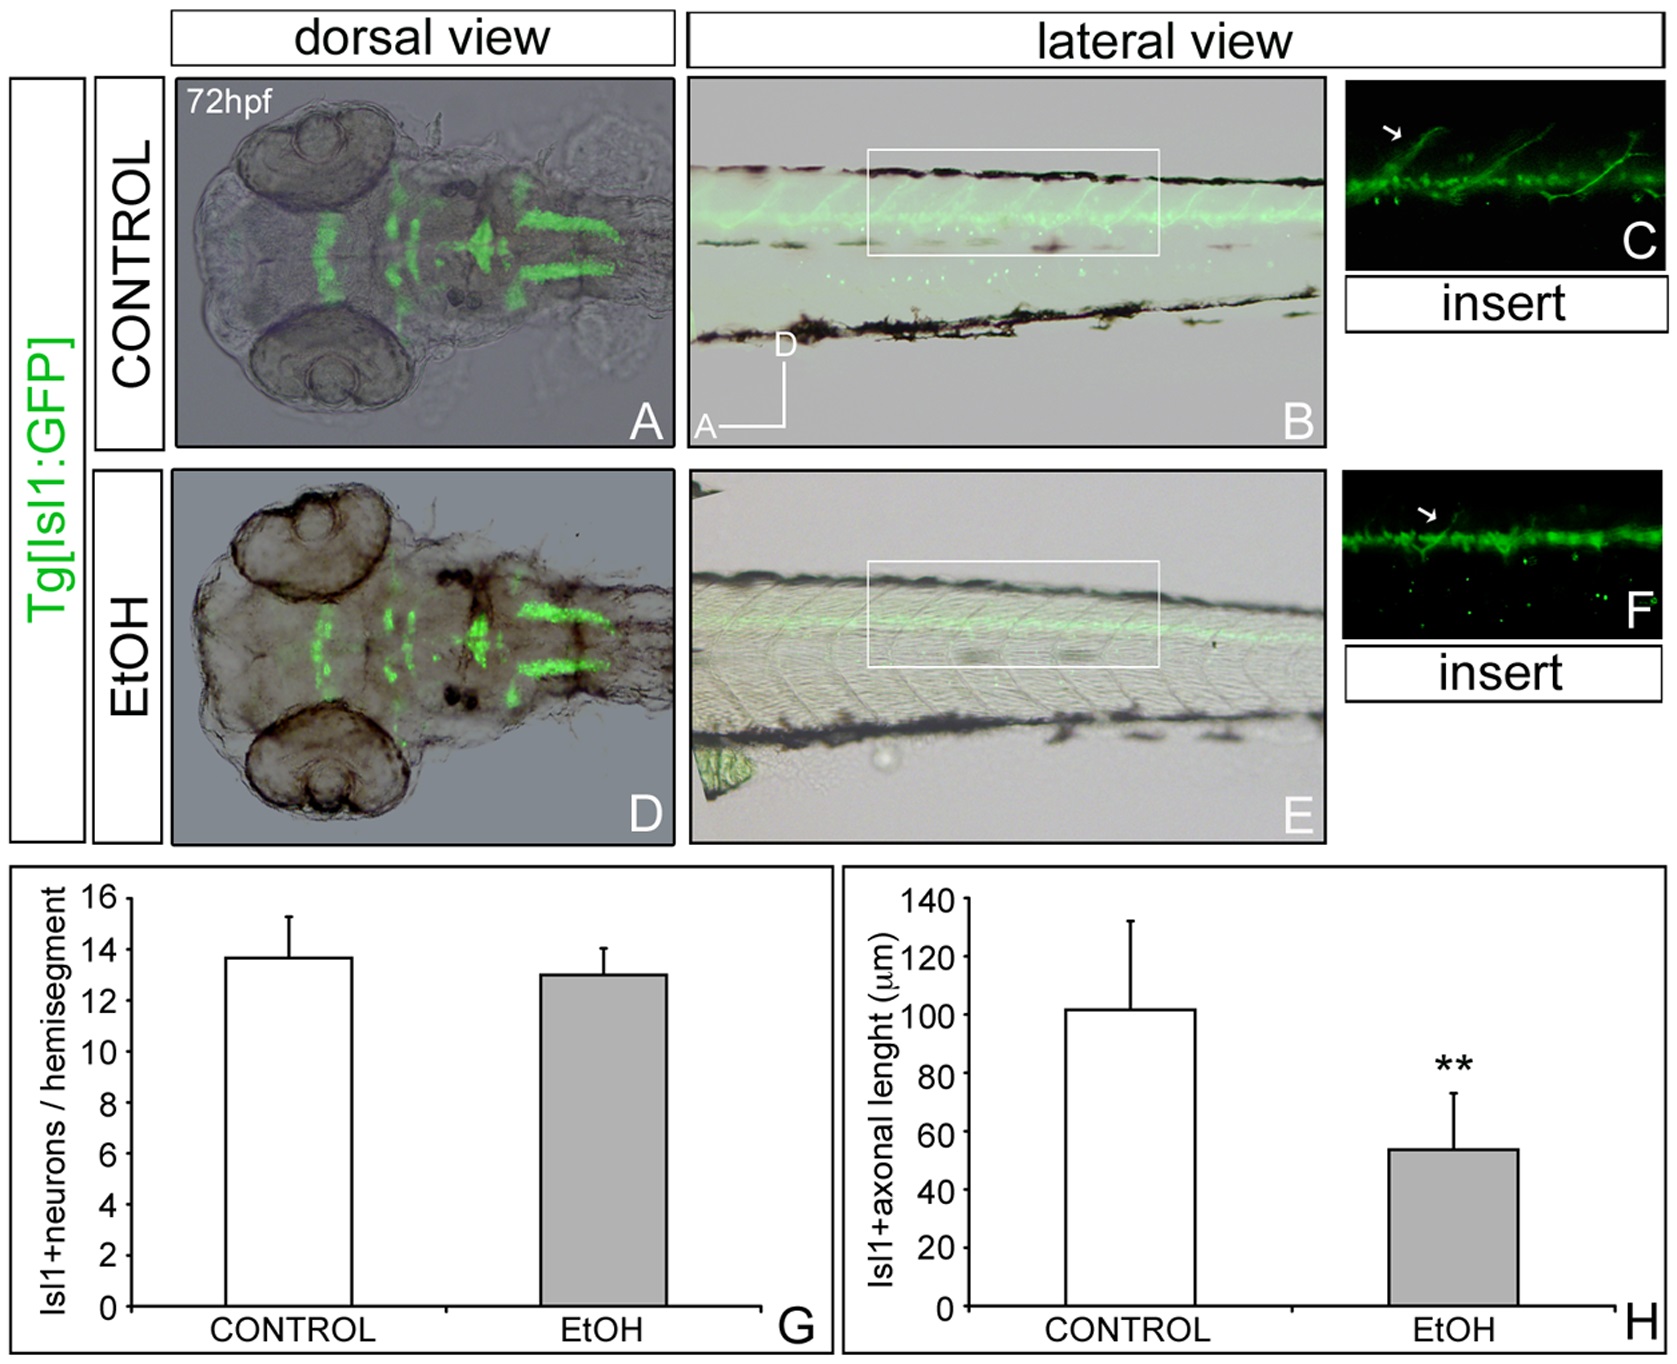
Fig. 3 Effects of ethanol in the population of motoneurons.
Analysis of Tg[Isl1:GFP] non-exposed embryos (A-C) and ethanol-exposed (D-F). (G) Quantification of GFP-positive motoneurons in specific hemisegments and (H) measurement of axonal lenght. Note that there is not an overall change in the pattern of motoneurons or number of them in treated embryos, although axonal length is diminished.
Figure Data
Acknowledgments
This image is the copyrighted work of the attributed author or publisher, and
ZFIN has permission only to display this image to its users.
Additional permissions should be obtained from the applicable author or publisher of the image.
Full text @ PLoS One