
- Title
-
Functional characterization of Prickle2 and BBS7 identify overlapping phenotypes yet distinct mechanisms
- Authors
- Mei, X., Westfall, T.A., Zhang, Q., Sheffield, V.C., Bassuk, A.G., Slusarski, D.C.
- Source
- Full text @ Dev. Biol.
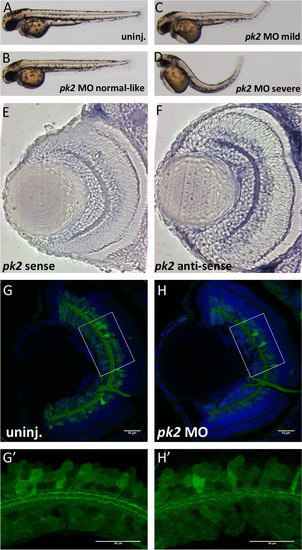
pk2 knockdown leads to body curvature and IPL neurogenesis defects in zebrafish. (A)–(D) Morphology of uninjected or pk2 MO injected embryos at 28 hpf. Injection of pk2 MO leads to body curvature phenotypes at different severity, from normal like to severe. (E) and (F). pk2 Expression in the retina sections. (E) Sense control; (F) anti-sense. pk2 is enriched in the ganglion cell layer and inner nuclear layer. (G)–(H′) Retinal neurogenesis defects in pk2 knockdown embryos. (G)–(H)_ Whole eye sections; (G′)–(H′) zoom-in view of boxed areas in (G)–(H). pk2 Knockdown leads to disorganization of inner plexiform layer synaptic connections, characterized by discontinuous layers. Scale bars are 30 μm in each image. EXPRESSION / LABELING:
PHENOTYPE:
|
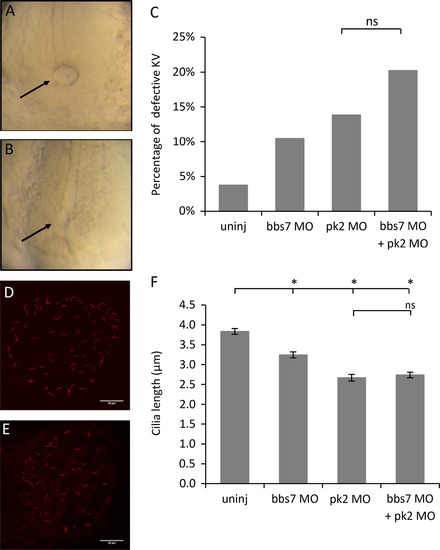
pk2 and bbs7 double knockdown shows no synergy in KV morphogenesis and KV cilia length. (A) and (B) An example of a normal KV (A) and a reduced KV (B). (C) Graph of percentage of KV defects. The double knockdown group show a KV defect that is comparable to each single knockdown group. pk2 MO dose is 1.25 ng. Uninj, n=159; bbs7 MO, n=134; pk2 MO, n=159; bbs7 MO+pk2 MO, n=173. ns, not significant by Fisher׳s Exact Test. (D) and (E) An example of normal cilia (D) and reduced cilia (E) at 8–10SS. Scale bars are 30 μm in each image. (F) Graph of cilia length measurements. bbs7 and pk2 knockdown each leads to shortened cilia, and the double knockdown shows a defect that is comparable to each single knockdown group. Uninj, n=223; bbs7 MO, n=201; pk2 MO, n=141; bbs7 MO+pk2 MO, n=191. Error bars are presented as standard error. p<0.01; ns, not significant; ANOVA with Tukey. PHENOTYPE:
|
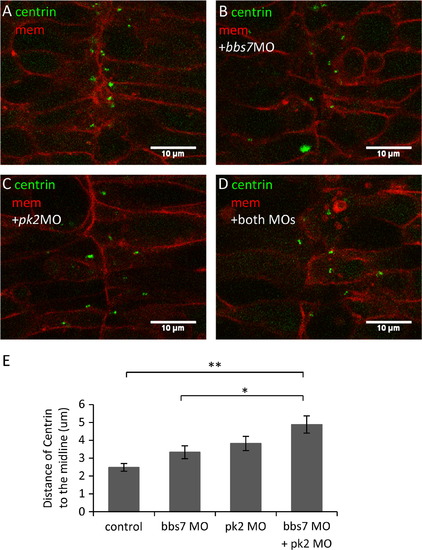
pk2 and bbs7 Double knockdown shows defects in centriole placement in the neural tube. (A)–(D) Centrin localization in the developing neural tube in pk2 and bbs7 single or double knockdown embryos. Green, Centrin-GFP; Red, mcherry-CAAX. In the control (A), centrin-GFP are localized close to the midline. In the single and double knockdown embryos ((B)–(D)) some cells have lateral placement of Centrin. Overall, the cell shape does not change. Scale bars are 10 μm in each image. (E) Quantification of distances of Centrin to the midline. While bbs7 and pk2 knockdown each leads to slight increase in the distance of Centrin to the midline, the double knockdown displays a significant increase in the distance. For control, n=119; bbs7 MO, n=33; pk2 MO, n=30; bbs7 MO+pk2 MO, n=45. Error bars are presented as standard error. **p<0.01; *p<0.05; ANOVA with Tukey. (For interpretation of the references to color in this figure legend, the reader is referred to the web version of this article.) |
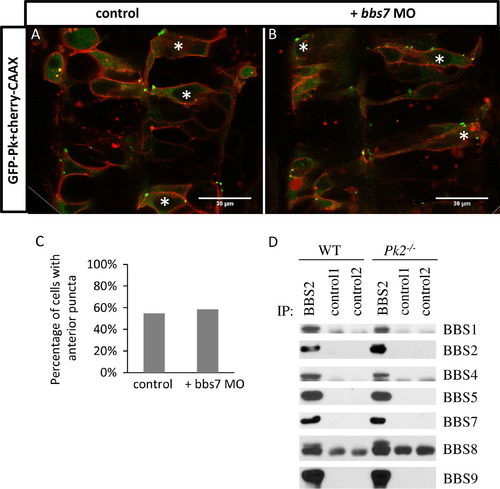
Normal Pk localization in bbs7 knockown embryos and normal BBsome formation in Pk2−/− mouse tissues. (A) and (B) GFP-Pk localization in the developing neural tube at 24 hpf. (A) GFP-Pk localization. (B) GFP-Pk localization with bbs7 MO injected. Asterisks mark cells with anterior GFP-Pk puncta. Anterior of the embryo is oriented to the top. Scale bars are 30 μm. (C) Quantification of percentage of GFP-positive cells with anterior puncta. For control, n=53; bbs7 MO, n=41. (D) Immunoprecipitation analysis demonstrates BBSome formation in Pk2 mutants. |
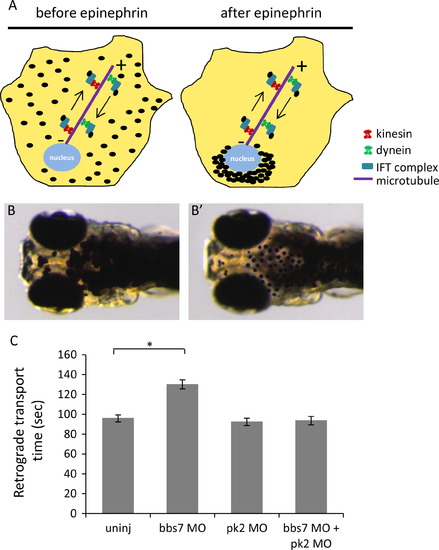
pk2 knockdown suppresses the bbs7-related retrograde melanosome transport defect. (A) Diagram of melanosome transport in melanocytes by the intracellular transport machinery. Dark-adapted are dispersed by anterograde transport while in response to light, they move to the perinuclear region by retrograde transport. (B)–(B′) 5 dpf Zebrafish larva before and after epinephrine treatment. Epinephrine stimulates retrograde transport while caffeine stimulates anterograde transport. (C) Graph of retrograde transport time in different groups. bbs7 knockdown leads to a delay in the retrograde transport while pk2 knockdown alone does not. However, the double knockdown larvae show a suppression of the retrograde transport delay. Uninj, n=50; bbs7 MO, n=52; pk2 MO, n=50; bbs7 MO+pk2 MO, n=51. Error bars are presented as standard error. p<0.01; ANOVA with Tukey. PHENOTYPE:
|

ZFIN is incorporating published figure images and captions as part of an ongoing project. Figures from some publications have not yet been curated, or are not available for display because of copyright restrictions. PHENOTYPE:
|
Reprinted from Developmental Biology, 392(2), Mei, X., Westfall, T.A., Zhang, Q., Sheffield, V.C., Bassuk, A.G., Slusarski, D.C., Functional characterization of Prickle2 and BBS7 identify overlapping phenotypes yet distinct mechanisms, 245-55, Copyright (2014) with permission from Elsevier. Full text @ Dev. Biol.