
|
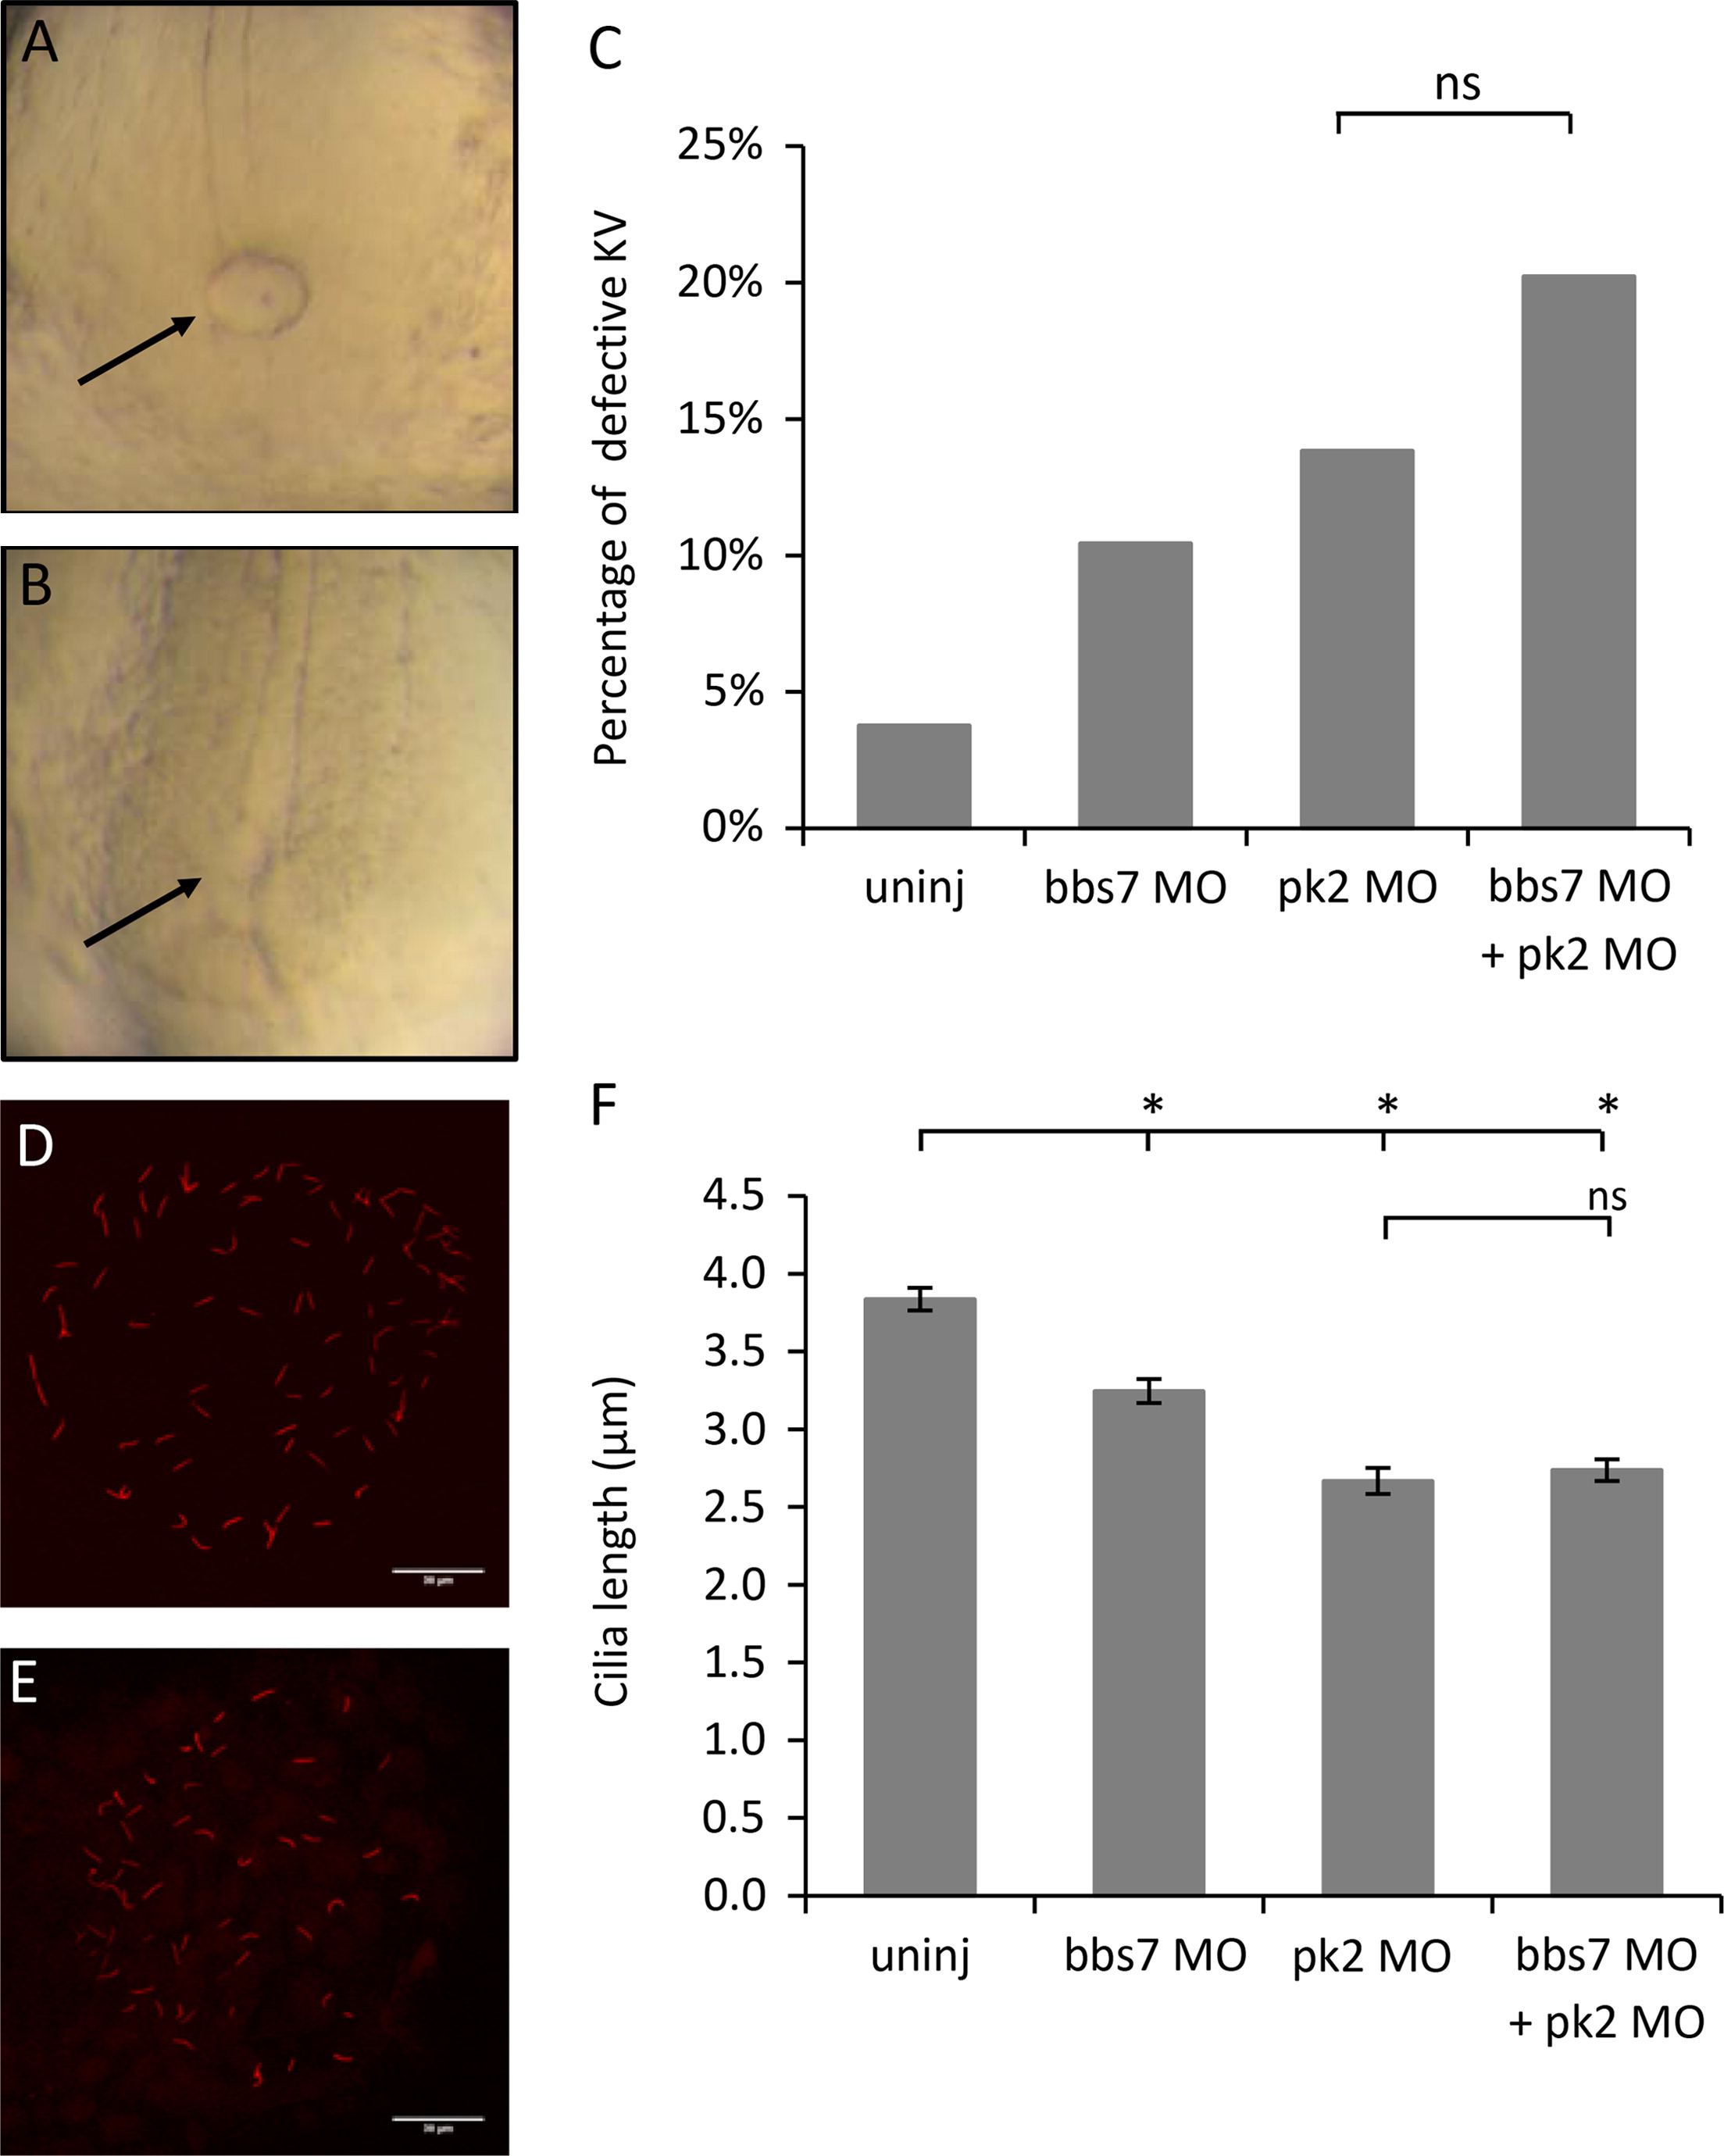
Fig. 2
pk2 and bbs7 double knockdown shows no synergy in KV morphogenesis and KV cilia length. (A) and (B) An example of a normal KV (A) and a reduced KV (B). (C) Graph of percentage of KV defects. The double knockdown group show a KV defect that is comparable to each single knockdown group. pk2 MO dose is 1.25 ng. Uninj, n=159; bbs7 MO, n=134; pk2 MO, n=159; bbs7 MO+pk2 MO, n=173. ns, not significant by Fisher׳s Exact Test. (D) and (E) An example of normal cilia (D) and reduced cilia (E) at 8–10SS. Scale bars are 30 μm in each image. (F) Graph of cilia length measurements. bbs7 and pk2 knockdown each leads to shortened cilia, and the double knockdown shows a defect that is comparable to each single knockdown group. Uninj, n=223; bbs7 MO, n=201; pk2 MO, n=141; bbs7 MO+pk2 MO, n=191. Error bars are presented as standard error. p<0.01; ns, not significant; ANOVA with Tukey.
Reprinted from Developmental Biology, 392(2), Mei, X., Westfall, T.A., Zhang, Q., Sheffield, V.C., Bassuk, A.G., Slusarski, D.C., Functional characterization of Prickle2 and BBS7 identify overlapping phenotypes yet distinct mechanisms, 245-55, Copyright (2014) with permission from Elsevier. Full text @ Dev. Biol.