- Title
-
Arachidonic acid enhances turnover of the dermal skeleton: studies on zebrafish scales
- Authors
- de Vrieze, E., Moren, M., Metz, J.R., Flik, G., Lie, K.K.
- Source
- Full text @ PLoS One
|
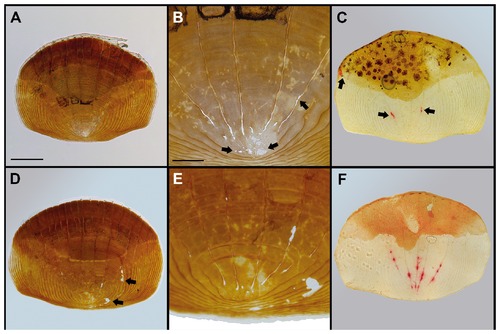
Effects of the different diets on scale mineralization. Representative examples of scales on which the quantifications from Figure 1 were based. A: Example of a scale from the low ARA group stained for mineralization (Von Kossa staining, calcium phosphates stained brown). The scale is almost completely mineralized and the brown staining is only absent in the focus (lower central region) of the scale. Bar = 250 μm. B: Detailed image of the focus of the scale shown in (A) with several unmineralized small resorption pits where staining is absent (arrows). Bar = 100 μm. C: TRAcP activity-stained ontogenetic scale from the low ARA group with few red-stained areas positive for TRAcP activity, indicated by arrows. Bar = 250 μm. D: Von Kossa stained ontogenetic scale from the high ARA group. Arrows indicate resorption pits outside the focus, seen more often in scales from high than from low ARA fed fish. Bar = 250 μm. E: Detailed image of the scale shown in (D) with more resorption pits with typical round edges as a result of osteoclastic matrix degradation. Bar = 100 μm. F: TRAcP activity-stained ontogenetic scale from the high ARA group with more spots stained red for TRAcP activity than in the low ARA group, indicating the presence of more osteoclasts in this group. Bar = 250 μm. |

Unillustrated author statements |

