- Title
-
Zebrafish tissue injury causes up-regulation of interleukin-1 and caspase dependent amplification of the inflammatory response
- Authors
- Ogryzko, N.V., Hoggett, E.E., Solaymani-Kohal, S., Tazzyman, S., Chico, T.J., Renshaw, S.A., and Wilson, H.L.
- Source
- Full text @ Dis. Model. Mech.
|
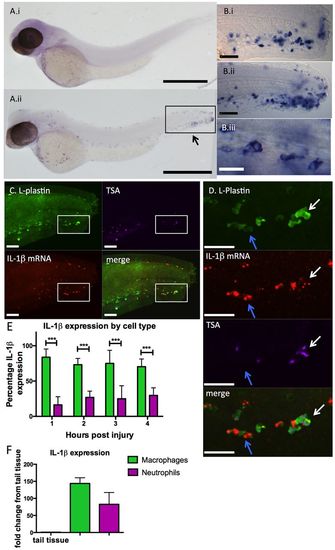
IL-1β expression is induced in leukocytes throughout the embryo in response to injury. Expression analysis of IL-1β by in situ hybridisation. (Ai) Embryos fixed at 48 hours post-fertilisation (hpf) show no IL-1β expression before injury, but IL-1β expression can be detected in cells throughout the embryo 2 hours post injury (hpi) by tailfin transection (Aii). Arrow indicates area represented in Bi,ii. Scale bars: 500 μm. (Bi–ii) IL-1β expression at the site of injury appears localised to cells with typical leukocyte morphology: close up views of region represented in Aii by a box in (Bi) 24 hpf embryos at 2 hpi and (Bii) 48 hpf embryos 2 hpi. Scale bars: 50 μm. (Biii) Magnified image of tail region: IL-1β-positive cells have large nuclei and leukocytic morphology. Scale bar: 20 μm. (C) 48-hpf embryos were fixed and at 2 hpi were probed with anti-L-plastin (green; labelling leukocytes), stained for endogenous neutrophil peroxidase activity with Cy5 TSA (purple) and FISH performed to detect IL-1β mRNA (red) to determine the localisation of IL-1β in response to injury. Scale bars: 40 μm. (D) Close-up of boxed area shown in C. Scale bars: 40 μm. IL-1β was detected both in neutrophils (TSA+;L-plastin+, white arrows) and macrophages (TSA;L-plastin+, blue arrows). (E) Quantification of IL-1β-expressing cells revealed expression predominantly in macrophages at all time points assayed (***Pd0.001 by multiple t-test with Bonferroni correction, n=8 performed as two independent experiments). (F) IL-1β was detected at very high levels by qRT-PCR in FACS-isolated zebrafish leukocytes when normalised to uninjured tail tissue. |

ZFIN is incorporating published figure images and captions as part of an ongoing project. Figures from some publications have not yet been curated, or are not available for display because of copyright restrictions. PHENOTYPE:
|
|
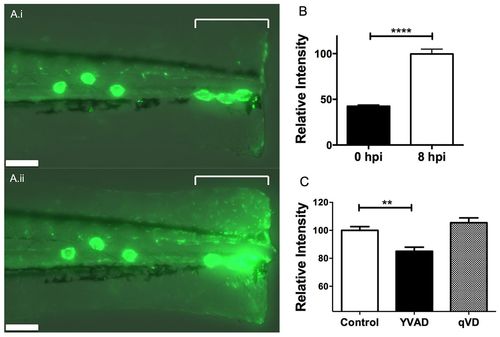
Caspase-1 inhibitor YVAD downregulates NF-κB activation in response to injury. (A) Fluorescence photomicrograph of pNF-κB:EGFP embryos following tailfin transection at 1 hpi (i) and 8 hpi (ii) indicating the region quantified (square bracket). Scale bars: 100 μm. (B) There is a 2.4-fold increase in EGFP fluorescence in response to injury, quantifiable as average fluorescent intensity across the transection site (indicated in A). ****Pd0.0001 by t-test. (C) Embryos treated with 50 μM YVAD show a reduction in EGFP fluorescence at 8 hpi compared with DMSO-treated controls and embryos treated with qVD. **Pd0.01 by one-way ANOVA with Dunnett’s post-test. n=30 performed as three independent experiments. EXPRESSION / LABELING:
PHENOTYPE:
|

ZFIN is incorporating published figure images and captions as part of an ongoing project. Figures from some publications have not yet been curated, or are not available for display because of copyright restrictions. EXPRESSION / LABELING:
PHENOTYPE:
|

ZFIN is incorporating published figure images and captions as part of an ongoing project. Figures from some publications have not yet been curated, or are not available for display because of copyright restrictions. PHENOTYPE:
|


