
- Title
-
Zebrafish midbrain slow-amplifying progenitors exhibit high levels of transcripts for nucleotide and ribosome biogenesis
- Authors
- Recher, G., Jouralet, J., Brombin, A., Heuzé, A., Mugniery, E., Hermel, J.M., Desnoulez, S., Savy, T., Herbomel, P., Bourrat, F., Peyriéras, N., Jamen, F., and Joly, J.S.
- Source
- Full text @ Development
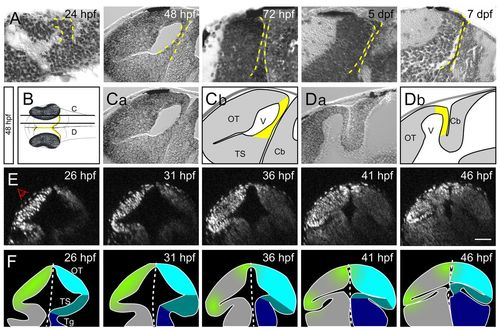
PML morphogenesis in zebrafish from 1 to 7 dpf. (A) Parasagittal sections of zebrafish from 24 hpf to 7 dpf. As development proceeds, the PML (delineated by a yellow dashed line) becomes thinner and tightly apposed to the OT. (B) Schematic dorsal view of an embryo at 48 hpf. Planes of the sagittal sections in C (more lateral) and D (more medial) are indicated. The PML is found at the margin of the OT (yellow). (C) On lateral sections, the PML connects the OT to the TS. (D) On medial sections, the PML connects the OT to the cerebellum. (E,F) Embryo imaged from its left side (E) and corresponding interpretive schematics (F). Reconstructed midbrain transverse sections were taken at 5-hour intervals. Proliferation (green) becomes restricted to an area between the OT (light blue) and the TS (mid-blue). The tegmentum is in dark blue. Cb, cerebellum; OT, optic tectum; Tg, tegmentum; TS, torus semicircularis; V, ventricle. Scale bar: 50 μm. |
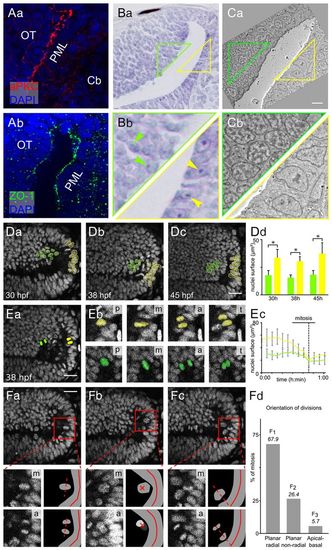
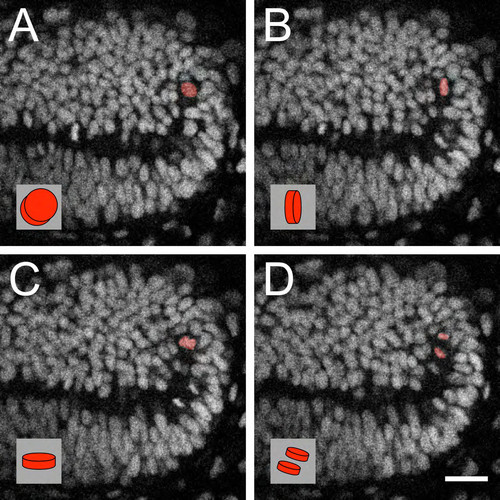
The PML is a neuroepithelial proliferation zone. (A) Sagittal sections at 48 hpf showing the expression of apical markers in PML cells: aPKC (a) and ZO-1 (b). Nuclei are stained with DAPI. (B) Nissl staining of sagittal sections showing that PML cells (yellow triangle) have larger nuclei with bigger nucleoli than OT cells (green triangle). Arrowheads indicate nucleoli. (C) Electron microscopy image of a sagittal section at 48 hpf showing that PML cells (yellow triangle) have decondensed chromatin, whereas chromatin in OT cells (green triangle) is condensed. (D) Sagittal optical sections of the OT from a Tg(Xla.Eef1a1:H2B-Venus) embryo. Interphase nuclei in the PML (yellow) are larger than at the margin of the OT (green). At all stages, the surface areas of the PML and the OT nuclei are significantly different (Mann-Whitney U-test, *P<0.001); error bars indicate s.d. (E) Average PML and OT nucleus size for ten mitoses. (a) Location of tracked nuclei (as detailed in b). p, prophase/prometaphase; m, metaphase; a, anaphase; t, telophase/cytokinesis. (c) M phase is indicated by a dotted line. OT, green; PML, yellow. (F) Mitosis orientations. (a) Planar radial division [30:56 (hours:minutes) hpf]. (b) Planar non-radial division (30:52 hpf). (c) Apicobasal division (31:13 hpf). (Bottom panels) Enlarged metaphase plate (labelled m), subsequent anaphase (labelled a) and corresponding interpretive diagrams. For planar non-radial divisions (b), the two daughter cells are not in the same plane. The anaphase image is the sum of the images centred on the two daughter cells. The red cross indicates the axes of the planar non-radial mitoses. Of 53 mitoses, 36 are planar radial, 14 are planar non-radial and 3 are apicobasal. (d) Non-random predominantly planar radial mitoses according to χ2 test (P<0.001). Cb, cerebellum; OT, optic tectum; PML, peripheral midbrain layer. Scale bars: 20 μm. |
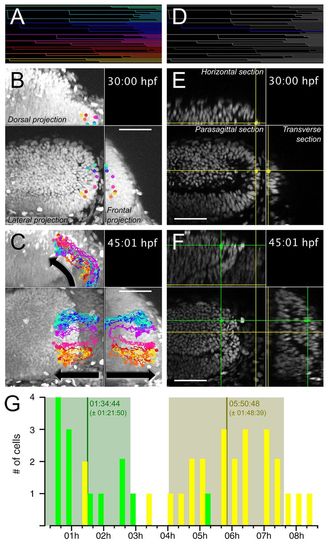
Slow-amplifying PML cells give rise to tectal FAPs. PML cells were tracked from 30:00 hpf to 45:01 hpf. The complete lineage tree is shown in A. Cells originating from the PML at 30 hpf are found in the external part of the OT 15 hours later (B,C). In B and C, eight clonal cell trajectories, as indicated with different colours, have been overlaid on a volume projection of the left midbrain. The dots indicate the position of the cells at 30 hpf (B) and 45:01 hpf (C) and the lines trace the past trajectory of each clone. For the full movie, see supplementary material Movie 4. (D-F) A clone (represented by the intersection of the cross at the corresponding sagittal, horizontal and transverse planes) is followed from the PML, where it achieved two mitoses (E), to the OT, where two further mitoses occurred (F). For the full movie, see supplementary material Movie 5. (G) Cell cycle durations are separated into two clusters: OT (green) FAP cycles, 1:35±1:22 hours (n=13); PML (yellow) SAP cycles, 5:51±1:49 hours (n=25). Scale bars: 50 μm. |

Transcript distribution in the midbrain: ‘large’ and ‘thin’ domains. (A) Whole-mount embryos (b,e) and parasagittal sections (c,f) following in situ hybridisation (ISH) with pcna (b,c) and nop56 (e,f) probes. pcna is expressed in a ‘large’ domain containing all proliferating cells. The nop56 expression domain is ‘thin’ and restricted to PML SAPs. (B) The pes ISH signal colocalises with PML cells (the largest midbrain cells). (a) Nuclear DAPI staining. (b) Inverted colour brightfield image of the same field showing the pes ISH signal. Inset shows the real colour brightfield image. (c) Colour-coded nuclei surface. On the blue-red scale, red corresponds to 22 μm2 and dark blue to 0 μm2. (d) Overlay of the inverted brightfield image with the nuclei border colour-coded drawing. Red nuclei exhibit a strong pes ISH signal. (C) Sagittal sections of embryos at 2 dpf. ISH long staining time emphasizes PML-specific gene expression. Scale bar: 10 μm. EXPRESSION / LABELING:
|
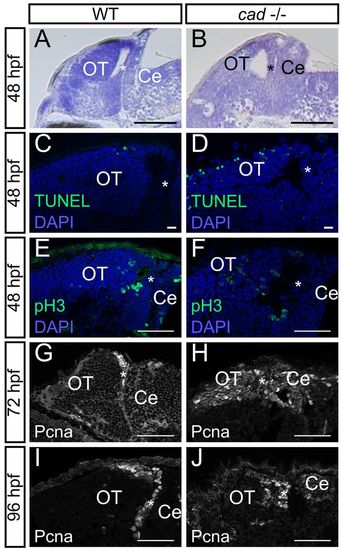
Absence of cad function in homozygous mutant embryos leads to proliferation defects and massive cell death in the midbrain. (A,B) Sagittal sections of wild-type (A) and perplexed (B) embryos with Nissl staining at 48 hpf. perplexed mutant displays atrophy of the tectum and PML thickening. (C,D) Sagittal sections following TUNEL staining at 48 hpf. More apoptotic cells are observed in cad-/- (D) than in wild-type (C) embryos. (E,F) Phospho-histone H3 labelling at 48 hpf showing the presence of proliferative cells not only in the periphery of the tectum but also in the central part in perplexed mutants. (G-J) Pcna immunostaining at 72 and 96 hpf showing persistence of wide proliferation zones in the OT of perplexed mutants at late larva stages. Anterior is at the left and dorsal at the top of each image. OT, optic tectum, Ce, cerebellum. The asterisk indicates the PML. Scale bars: 100 μm in A,B; 10 μm in C,D; 20 μm in G; 50 μm in E,F,H-J. EXPRESSION / LABELING:
|
Metaphase plate rotation prior to mitosis The metaphase plate is initially in the plane of imaging, then perpendicular to image plane, parallel to the PML and finally turns perpendicular to the PML, resulting in a planar radial division. |
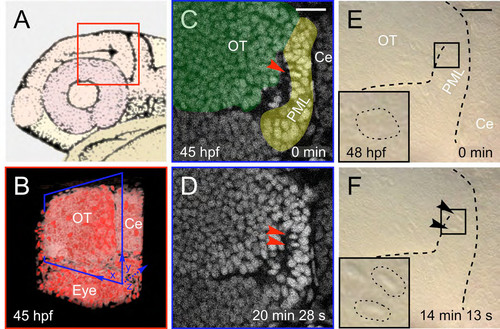
TPLSM imaging: orientation and non-invasiveness (A) Schematic drawing of a 31 hpf (prim-16) zebrafish larva head (adapted from (Kimmel et al., 1995)). Fish were mounted laterally so as to have access to the lateral side of the brain with a dipping lens objective. Red square: field of view imaged in (B). (B) 3D rendering (obtained with Mov-IT) of the imaged field at 45 hpf. Anterior part is on the left and dorsal side on the top. OT: optic tectum; Ce: cerebellum. Blue square: sagittal optical sections in (C) and (D). (C-F) Location and timing of mitoses in the PML for transgenic fish (TPLSM imaging, C-D) and WT fish (Nomarski imaging [Nikon DXM 1200 camera on Zeiss SV11 (Herbomel, 1999)], E-F). Prophase (C-E) and telophase (D-F) stages of a mitosis (arrow heads). Scale bars: 20 μm. |

Pattern of PML and proliferation genes extracted from ZFIN (A) Expression pattern of cdc20 as an example of genes expressed in all proliferation zones of the anterior nervous system. (B) Expression patterns of the thinly expressed PML-specific gene cad at early stages (1-4 somites to 10-13 somites, 14-/19 somites and 20-25 somites to prim-5). (C) Expression pattern of the PML-specific gene nop58 at prim-15 to prim-25 stages (C1-2) and at high-pec / long-pec stages (C3-4). (D-Z; AA-ZZ) Expression patterns of 49 PML genes (in blue frame). (AAA-ZZZ; AAAA-ZZZZ; AAAAA-PPPPP) Expression patterns of 68 proliferation genes (in red frame). Stages and views are indicated at the top of each picture. In each line, the first and second pictures show ISH expression pattern in a prim 15-25 embryo (30 hpf - 36 hpf) in dorsal and lateral views, respectively. The third and fourth pictures show the ISH expression pattern in a high-pec / long-pec embryo (42 hpf – 48 hpf) in dorsal and lateral views, respectively. |