
Fig. S2
- ID
- ZDB-FIG-140219-28
- Publication
- Recher et al., 2013 - Zebrafish midbrain slow-amplifying progenitors exhibit high levels of transcripts for nucleotide and ribosome biogenesis
- Other Figures
- All Figure Page
- Back to All Figure Page
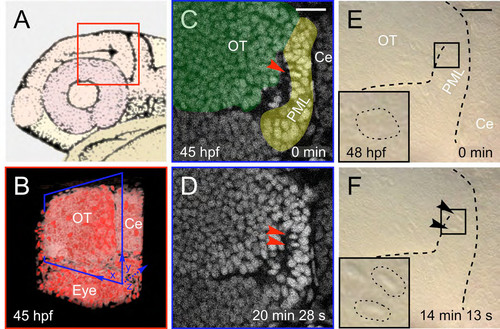
TPLSM imaging: orientation and non-invasiveness (A) Schematic drawing of a 31 hpf (prim-16) zebrafish larva head (adapted from (Kimmel et al., 1995)). Fish were mounted laterally so as to have access to the lateral side of the brain with a dipping lens objective. Red square: field of view imaged in (B). (B) 3D rendering (obtained with Mov-IT) of the imaged field at 45 hpf. Anterior part is on the left and dorsal side on the top. OT: optic tectum; Ce: cerebellum. Blue square: sagittal optical sections in (C) and (D). (C-F) Location and timing of mitoses in the PML for transgenic fish (TPLSM imaging, C-D) and WT fish (Nomarski imaging [Nikon DXM 1200 camera on Zeiss SV11 (Herbomel, 1999)], E-F). Prophase (C-E) and telophase (D-F) stages of a mitosis (arrow heads). Scale bars: 20 μm. |