
- Title
-
A compact, in vivo screen of all 6-mers reveals drivers of tissue-specific expression and guides synthetic regulatory element design
- Authors
- Smith, R.P., Riesenfeld, S.J., Holloway, A.K., Li, Q., Murphy, K.K., Feliciano, N.M., Orecchia, L., Oksenberg, N., Pollard, K.S., and Ahituv, N.
- Source
- Full text @ Genome Biol.
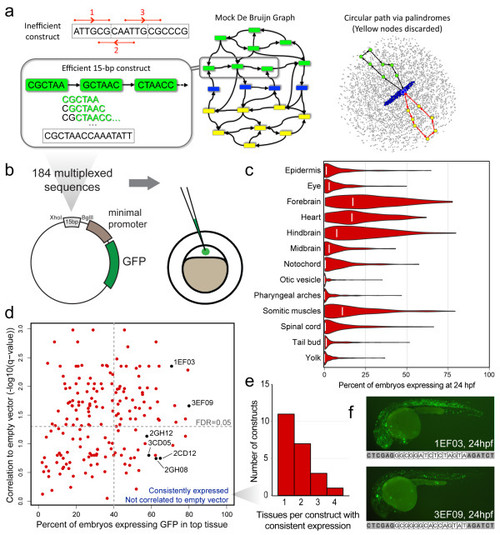
In vivo regulatory screen of all 6-mers. (a) Left top: naively concatenating three 6-mers creates an oligomer with multiple representatives of ATTGCG (red bars). Center and left: cartoon of a de Bruijn graph. Nodes (colored boxes) represent 6-mers; edges (arrows) represent overlap. A standard de-Bruijn-sequence library is built from one path that traverses each of 4,096 nodes once. Constructed from multiple paths, our MRCC library instead uses one representative for each pair of reverse-complementary 6-mers (green and yellow; self-reverse-complementary palindromes in blue), making it nearly 50% smaller (Additional file 1). Right: 16 of 16,384 edges shown. Our algorithm removes reverse-complementary paths (black, red) between palindrome pairs and then decomposes the remaining graph into reverse-complementary cycles. It allowed us to design an ultra-compact library of DNA sequences with uniform 6-mer coverage. (b) Schematic depicting the sub-cloning of each 15-bp multiplexed oligomer into the E1b-Tol2 vector and subsequent injection into single-cell zebrafish embryos. (c) Violin plots depicting the distribution of the expression patterns of each tissue at 24 hpf. White lines indicate the fractional expression values for the empty vector construct. (d) Scatter plot depicting the method by which we selected consistently expressed multiplexed oligomers whose expression was not significantly correlated to minimal-promoter bias. The vertical dotted line denotes the 40% fractional expression threshold that was used, whereas the horizontal dotted line corresponds to a false discovery rate-adjusted P-value of 0.05. (e) Histogram depicting the tissue specificity of the 22 uncorrelated, consistently expressed constructs at 24 hpf. (f) Representative images at 24 hpf for embryos injected with 1EF03 (top) and 3EF09 (bottom), exhibiting broad expression that was correlated with that of the empty vector expression. The full sequence of each construct (with XhoI and BglII flanking sites) is listed below each figure. Both constructs have a 5′ GC-rich region. GFP, green fluorescent protein. |
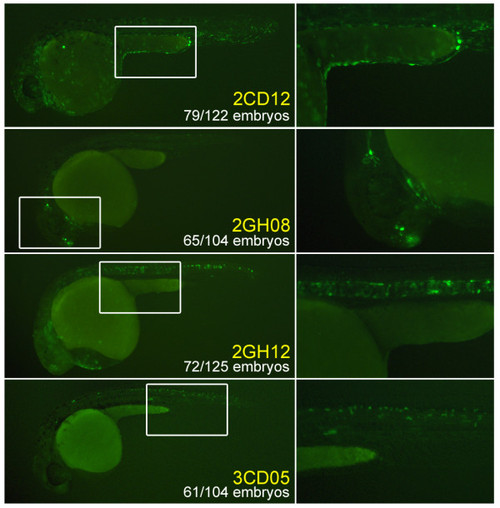
The four uncorrelated constructs chosen for follow-up experiments due to their consistent, specific expression patterns: 2CD12/epidermis; 2GH08/brain (showing both forebrain and otic lateral line expression); 2GH12/notochord; 3CD05/spinal cord. White rectangles indicate regions that are magnified in the right side panels. |
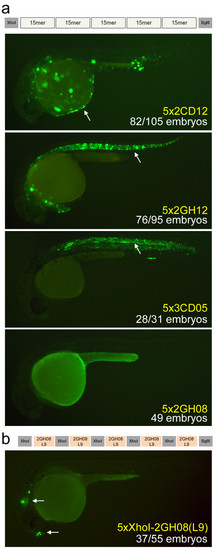
Design of synthetic enhancers from short multiplexed sequences. (a) We generated concatemers containing five copies of each of the six multiplexed sequences. Three of these (5x2CD12/epidermis, 5x2GH12/notochord, 5x3CD05/spinal cord) drove more intense expression in the same tissue as the original 15-bp sequence. The fourth construct, 5x2GH08/brain, did not produce any detectable expression, suggesting that the XhoI-flanking sequence may be important. White arrows mark the epidermis, notochord, and spinal cord, respectively. (b) A second version of the 2GH08/brain concatemer contained five tandem repeats of the XhoI flanking region with the 2GH08(L9) functional sequence that was identified by the 9-bp dissection experiments. This arrangement produced a strong regulatory element that drives consistent expression to the forebrain and otic lateral line at 24 and 48 hpf. White arrows mark the forebrain and otic lateral line patterns. All pictures are of 24 hpf embryos. |
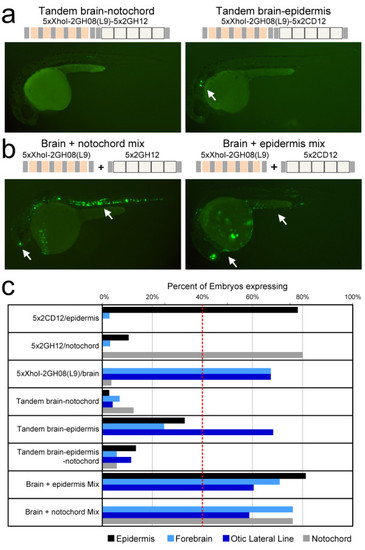
Combination of synthetic regulatory elements underscores the importance of context. (a) Left: a tandem combination of the 5xXhoI-2GH08(L9)/brain and 5x2GH12/notochord concatemers failed to produce any enhancer activity above background. Right: a tandem combination of the 5xXhoI-2GH08(L9)/brain and 5x2CD12/epidermis concatemers resulted in consistent otic lateral line expression. Expression in the forebrain and epidermis was detected inconsistently in a handful of embryos (such as the one shown), but not as intensely as the original concatemer. (b) Injection of a mixture of the 5xXhoI-2GH08(L9)/brain and 5x2GH12/notochord (left) or 5xXhoI-2GH08(L9)/brain and 5x2CD12/epidermis constructs (right) resulted in the expected combinatorial pattern (white arrows). (c) Percentage of embryos expressing in the epidermis, forebrain and notochord for the 5x concatemers individually, as combinations or as a mixture of two constructs. Tandem arrangement of concatemers in the same regulatory element largely failed to reproduce the expression patterns driven by concatemers individually or in a mixture, with the exception of the brain-epidermis combination, which preserved otic lateral line expression. |
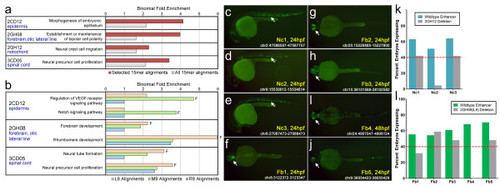
Short sequences contribute to endogenous developmental zebrafish enhancers. (a,b) Alignments of 15-bp multiplexed sequences and 9-bp sequences identified by functional dissection were intersected with predicted enhancers (defined by H3K4me1-positive, H3K4me3-negative ChIP-seq regions [12]). We then used GREAT [41] to find enriched ontology terms for nearby genes. In each case, a term consistent with the expression pattern was identified, suggesting that the sequences identified by our screen are performing specific roles in developing vertebrates. Plotted are binomial fold enrichment values for the specific 15-bp or 9-bp alignments. Functional 9-bp sequences are depicted by the letter F. To control for common developmental gene ontology terms, we include the binomial fold enrichment values for the H3K4me1+/me3- alignments of all 184 constructs (a) or the non-functional 9-bp sequences identified by functional dissection (b). We tested enhancer activity of 20 1,000-bp regions from the zebrafish genome that overlap with H3K4me1/me3- signal and contain an alignment for 2GH12/notochord or the 2GH08(L9)/brain sequence. (c-e) Three of ten 2GH12/notochord-containing regions (Nc1-3) showed strong notochord (Nc) enhancer expression at 24 hpf. (f-j) Five of ten 2GH08(L9)/brain-containing sequences (Fb1-5) were strong forebrain (Fb) enhancers at 24 or 48 hpf. The chromosomal coordinates of each enhancer are indicated (Zv9 zebrafish genome assembly) as well as the time point with the strongest expression. (k,l) Deletion of the 2GH12/notochord or 2GH08(L9)/brain sequence from the 1,000-bp enhancers leads to a reduction and, in several cases, abolition of the observed enhancer signal. Bars represent the percentages of fish exhibiting expression in the notochord (k) and forebrain (l) at the indicated time point provided in the pictures above. The red dotted line represents the 40% consistency cut-off used for this study. |
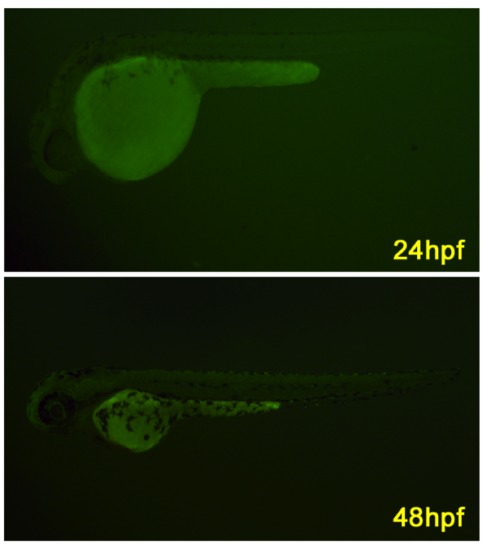
Representative negative embryos injected with the E1b-tol2 empty vector and photographed at 24 and 48hpf. |
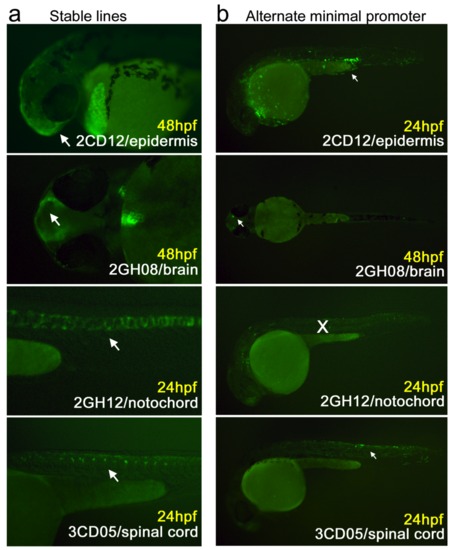
(a) Stable F1 transgenics were generated by breeding wildtype Ab females with F0 males expressing 2CD12/epidermis, 2GH08/brain, 2GH12/notochord, and 3CD05/spinal cord. In each case, the F1 fish exhibited the original expression pattern (white arrows). (b) For each of the four tissue-specific multiplexed constructs, the E1b minimal promoter was replaced by a 31bp TATA-box containing minimal promoter from the pGL4.23 vector (Promega). In every case, except 2GH12/notochord, the pGL minimal promoter constructs exhibited the same tissue expression pattern (white arrows) as the original multiplexed sequence. |
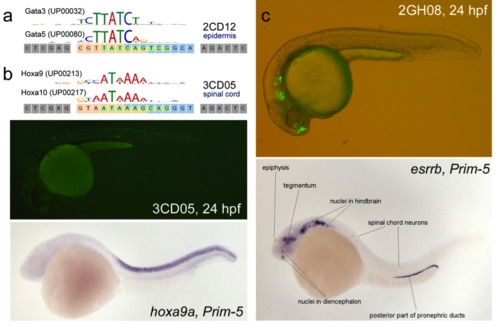
(a) Comparison between the UniPROBE position weight matrix for Gata5 and Gata3. (b) Top: Comparison between the UniPROBE position weight matrix for Hoxa10 and Hoxa9. Middle: 3CD05 showing GFP expression in the spinal cord at 24hpf. Bottom: Whole-mount in situ hybridization for hoxa9 at Prim-5 (~24 hpf) shows very specific staining in the spinal cord. Courtesy of zfin.org. (c) Top: Phase contrast/fluorescent overlay image of GFP driven by 2GH08 to the forebrain and lateral line ganglia. Bottom: Whole-mount in situ hybridization for esrrb at 24 hpf, which has a similar expression pattern. Labeling and figure provided courtesy of zfin.org. |
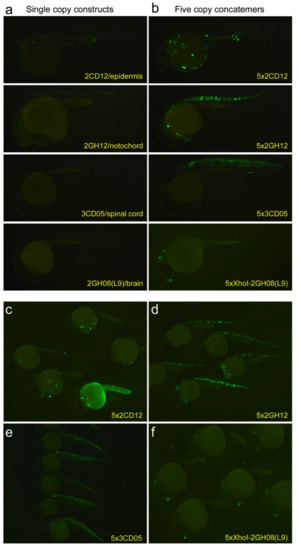
Ungained images of embryos injected with (a) single copy multiplexed oligomers or (b) their 5x concatemer counterparts. Photos were taken using exactly the same camera and exposure settings. (c-f) Group images of embryos at 24 hpf exhibiting consistent, robust expression of the four concatemers in their respective tissues. |
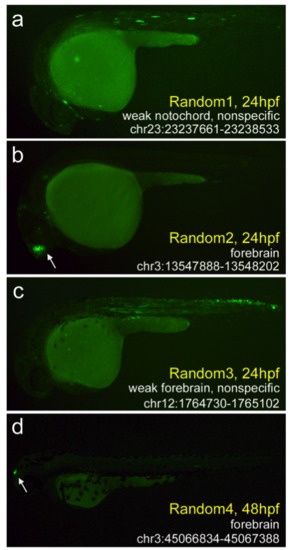
Four positive enhancers that were chosen randomly (in Microsoft Excel) from a list of 35,045 H3K4me1+/me3- hotspots. (a) Random1 is the sole region to produce notochord expression (23/50 embryos at 24 hpf) and also produced considerable somitic muscle expression. (b-d) Three enhancers with forebrain expression. For two of these (Random 2 and 4), GFP expression was strong and specific. The third (Random 3) produced considerable expression in the somitic muscle and spinal cord, with marginal forebrain expression (18/45 embryos at 24 hpf). The complete data set is available in Additional File 7. |