
|
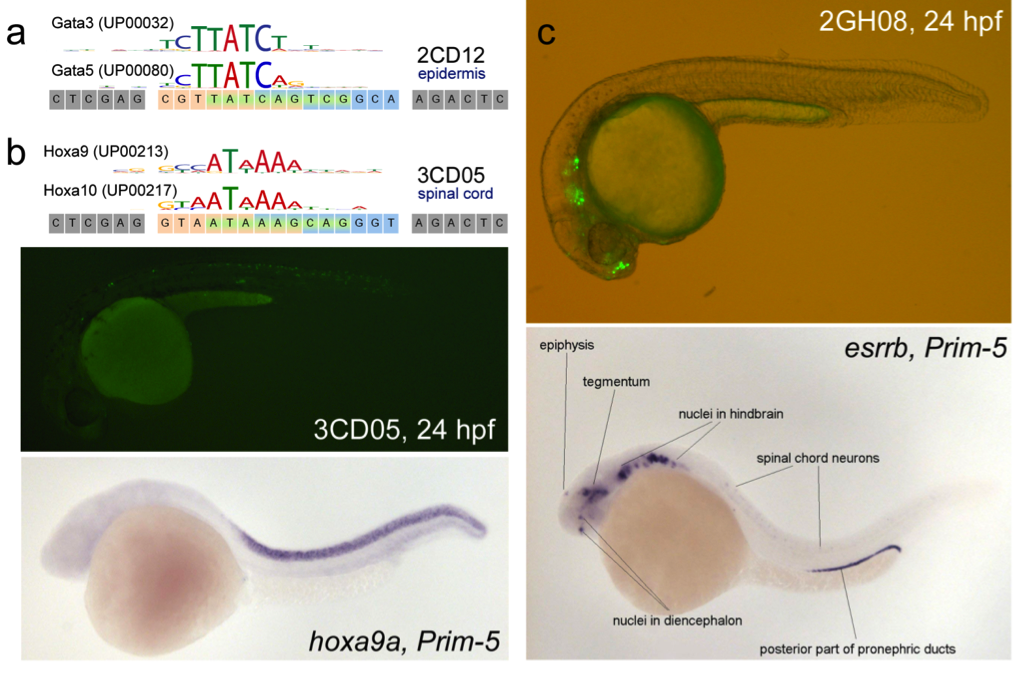
Fig. S4 (a) Comparison between the UniPROBE position weight matrix for Gata5 and Gata3. (b) Top: Comparison between the UniPROBE position weight matrix for Hoxa10 and Hoxa9. Middle: 3CD05 showing GFP expression in the spinal cord at 24hpf. Bottom: Whole-mount in situ hybridization for hoxa9 at Prim-5 (~24 hpf) shows very specific staining in the spinal cord. Courtesy of zfin.org. (c) Top: Phase contrast/fluorescent overlay image of GFP driven by 2GH08 to the forebrain and lateral line ganglia. Bottom: Whole-mount in situ hybridization for esrrb at 24 hpf, which has a similar expression pattern. Labeling and figure provided courtesy of zfin.org.