
FIGURE
Fig. S7
- ID
- ZDB-FIG-140619-19
- Publication
- Smith et al., 2013 - A compact, in vivo screen of all 6-mers reveals drivers of tissue-specific expression and guides synthetic regulatory element design
- Other Figures
- All Figure Page
- Back to All Figure Page
Fig. S7
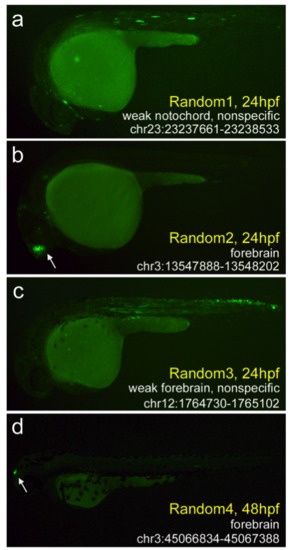
Four positive enhancers that were chosen randomly (in Microsoft Excel) from a list of 35,045 H3K4me1+/me3- hotspots. (a) Random1 is the sole region to produce notochord expression (23/50 embryos at 24 hpf) and also produced considerable somitic muscle expression. (b-d) Three enhancers with forebrain expression. For two of these (Random 2 and 4), GFP expression was strong and specific. The third (Random 3) produced considerable expression in the somitic muscle and spinal cord, with marginal forebrain expression (18/45 embryos at 24 hpf). The complete data set is available in Additional File 7. |
Expression Data
Expression Detail
Antibody Labeling
Phenotype Data
Phenotype Detail
Acknowledgments
This image is the copyrighted work of the attributed author or publisher, and
ZFIN has permission only to display this image to its users.
Additional permissions should be obtained from the applicable author or publisher of the image.
Full text @ Genome Biol.