
- Title
-
Functional analysis of a zebrafish myd88 mutant identifies key transcriptional components of the innate immune system
- Authors
- van der Vaart, M., van Soest, J.J., Spaink, H.P., and Meijer, A.H.
- Source
- Full text @ Dis. Model. Mech.
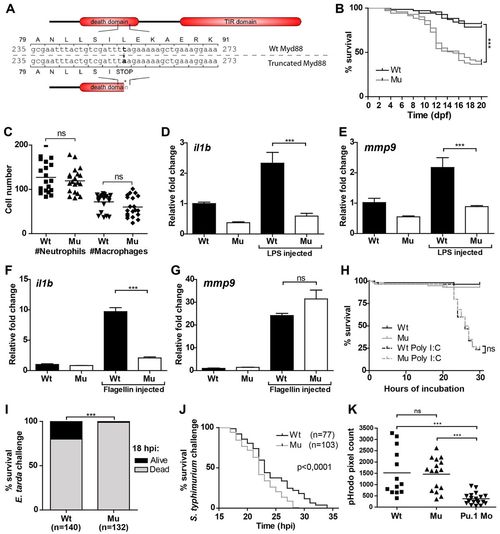
Characterization of myd88 mutant zebrafish and their survival following infection with E. tarda and S. typhimurium. (A) Mutant sequence and protein structure. Point mutation (threonine to alanine) in the death domain sequence of zebrafish myd88 introduces a premature stop codon. The truncated protein lacks the TIR domain and part of the death domain. Nucleotide and amino acid positions are indicated with respect to the translation start codon (B). Survival assays. Percentage survival during the first 20 days of development (under unchallenged conditions) is shown for two groups (n=70 per group) of myd88-/- mutants (Mu, gray lines) and myd88+/+ wild type (Wt, black lines), grown in two individual experiments. The groups are the F1 offspring of myd88-/- and myd88+/+ siblings born from heterozygous parents. At 20 dpf, 83% and 79% of wild types survived, compared with 37% and 40% of mutants. The asterisks indicate the significant difference between wild-type and mutant survival (P<0.0001), tested with a logrank test. (C). Quantification of leukocyte numbers. Total numbers of GFP-labeled neutrophils in 3 dpf myd88-/--mpx::egfp and myd88+/+-mpx::egfp embryos (n=20 per group) were counted under a fluorescence stereo microscope. Total numbers of macrophages were determined by performing whole mount L-plastin immunohistochemistry and deducting the number of mpx::egfp-positive neutrophils from the number of L-plastin-positive total leukocytes per embryo. Each data point represents an individual embryo and lines indicate the mean value. No significant difference (ns) in numbers of neutrophils or macrophages was observed with a t-test. (D-G). myd88-/- and wild-type embryos were injected with purified LPS (100 μg/ml), flagellin (100 μg/ml) or PBS as a control. Expression of il1b and mmp9 at 2 hpi was analyzed by qPCR. Data are combined from three biological replicates (n=20 per group) and statistical significance was determined by one-way ANOVA with Tukey’s multiple comparison method as a post-hoc test. (H). Poly I:C exposure. myd88-/- and wild-type embryos were exposed to poly I:C (500 μg/ml eggwater) starting at 5 dpf. Survival curves are based on data pooled from two individual experiments (n=60 per group in total). Statistical significance was determined by a logrank test. (I) E. tarda infection. At 28 hpf, myd88-/- and wild-type embryos were infected with <150 cfu E. tarda FL6-60 by injection into the blood island. The percentages of embryos surviving infection at 18 hpi are shown for myd88-/- (Mu, n=132, 1% surviving) and wild type (Wt, n=140, 20% surviving). Data are pooled from two individual experiments and statistical significance was tested with a contingency test. (J) S. typhimurium infection. Embryos were injected into the blood island at 28 hpf with <150 cfu of S. typhimurium strain SL1027. Survival curves for mutant (n=103, median survival 22 hpi) and wild-type embryos (n=77, median survival 23 hpi) are based on data pooled from two individual experiments. Statistical significance was determined by a logrank test. (K) Phagocytosis assay. Mutant and wild-type embryos were injected at 28 hpf into the blood island with E. coli cell wall particles labeled with pHrodo, a pH-dependent fluorogenic dye. After 2 hours, stereo fluorescence images were taken for fluorescent pixel quantification. Pu.1 morpholino-injected embryos (Pu.1 Mo), deficient in phagocytic leukocytes, were included as a control. Each data point represents an individual embryo and lines indicate the mean value. No significant difference was observed between wild-type and mutant embryos, but both groups were significantly different from Pu.1 morpholino-injected controls by one-way ANOVA with Tukey’s Multiple Comparison method as a post-hoc test. ***P<0.001; ns, not significant. EXPRESSION / LABELING:
PHENOTYPE:
|
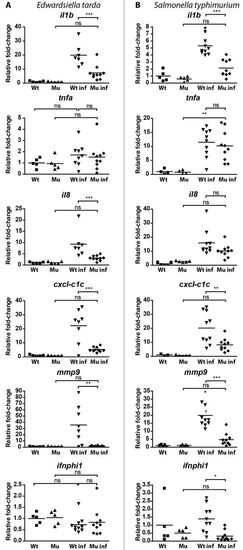
qPCR analysis of the response of myd88-/- and wild-type embryos to E. tarda or S. typhimurium infection. |
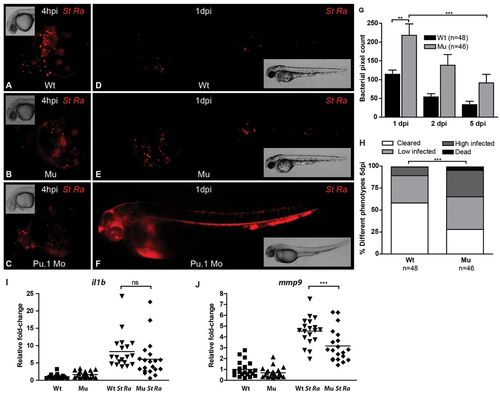
Bacterial burdens and qPCR analysis of gene expression in myd88-/- and wild-type embryos infected with the attenuated S. typhimurium Ra strain. (A-F) Representative stereo fluorescence images of infected embryos. At 28 hpf, embryos were infected by injection into the blood island using ~150 cfu of DsRed-labeled S. typhimurium Ra. Pu.1 morpholino-injected embryos (Pu.1 Mo; C,F), deficient in phagocytic leukocytes, were included for comparison with wild-type (Wt; A,D) and myd88-/- (Mu; B,E) embryos. Dispersal of infected leukocytes over the yolk sac at 4 hpi (A–C) and the progression of infection at 1 dpi (D–F) are shown. (G). Quantification of bacterial burden. Stereo fluorescence images of infected embryos at 1, 2 and 5 dpi were used for quantification of bacterial fluorescent pixels. Data are accumulated from two individual experiments. Significant differences were determined by one-way ANOVA with Tukey’s multiple comparison method as a post-hoc test. (H) Variation in phenotypes at 5 dpi. Embryos were categorized according to infection levels as cleared (no remaining bacterial fluorescent pixels or pixel count below 10), low infected (pixel count between 10 and 100), high infected (pixel count above 100) or dead. The distribution over categories was significantly different based on a contingency test. (I,J) qPCR analysis of pro-inflammatory genes. RNA samples from infected embryos (St Ra) and their controls were taken at 5 dpi to determine differences between myd88-/- (Mu) and wild-type (Wt) in the expression levels of il1b (I) and mmp9 (J). Each data point represents an individual embryo and lines indicate the mean relative expression level, with uninfected wild type set at 1. Statistical analysis performed by one-way ANOVA with Tukey’s multiple comparison method as a post-hoc test. The mean expression levels of both genes were lower in infected mutants than in infected wild types, but the difference for il1b was not significant whereas the difference for mmp9 was significant.**P<0.01, ***P<0.001; ns, not significant. |
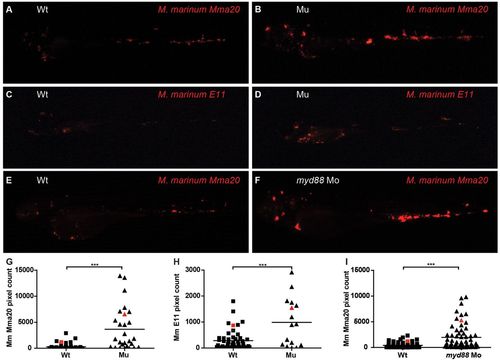
Bacterial .burdens of myd88-/- and wild-type embryos infected with M. marinum. (A–F) Representative stereo fluorescence images of infected embryos. At 28 hpf, myd88-/- (Mu) and wild-type (Wt) embryos were infected with <200 cfu of mCherry-labeled M. marinum strain Mma 20 (A,B) or strain E11 (C,D) by injection into the blood island. Stereo fluorescence images were taken at 3 (Mma20 strain) or 5 dpi (E11 strain). For comparison, wild-type and myd88-morpholino-injected embryos were infected with the same dose of M. marinum Mma 20 (E,F). (G–I) Quantification of bacterial burden. Red symbols indicate which infected individuals are shown as representative images in A–F. Bacterial pixel counts were determined based on stereo fluorescence images. Significant differences were determined by one-way ANOVA with Tukey’s Multiple Comparison method as a post-hoc test; ***P<0.001. PHENOTYPE:
|
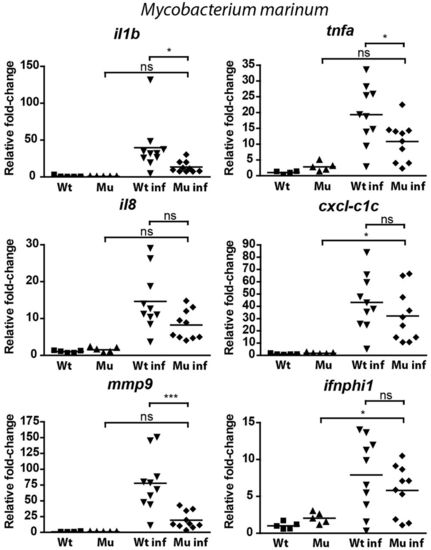
qPCR analysis of the response of myd88-/- and wild-type embryos to M. marinum infection. |