
- Title
-
Cug2 is essential for normal mitotic control and CNS development in zebrafish
- Authors
- Kim, H.T., So, J.H., Jung, S.H., Ahn, D.G., Koh, W., Kim, N.S., Kim, S.H., Lee, S., and Kim, C.H.
- Source
- Full text @ BMC Dev. Biol.
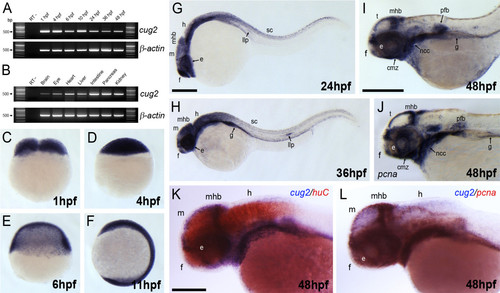
Expression pattern of cug2 in developing zebrafish embryos. A. Temporal expression profile of zebrafish cug2 by RT-PCR. Zebrafish cug2 transcripts have maternal and zygotic expression. β-actin is the loading control. B. The expression of cug2 is detected in the brain, eye, heart, liver, intestine, pancreas, and kidney in adult zebrafish. C-F. In cleavage (C), blastula (D), gastrula (E), and segmentation stages (F), cug2 transcripts are ubiquitously expressed throughout the embryonic body. G. At 24 hpf, cug2 transcripts are detected in the eye (e), forebrain (f), midbrain (m), midbrain-hindbrain boundary (mhb), hindbrain (h), spinal cord (sc), and lateral line primordium (llp). H. Expression of cug2 detected in the lateral line primordium, gut (g) and CNS at 36 hpf. I. Expression of cug2 in the ciliary marginal zone (cmz) in the eyes, tectum (t), midbrain-hindbrain boundary, neural crest cells (ncc), pectoral fin buds (pfb) and gut at 48 hpf. J. Expression pattern of pcna at 48 hpf. Scale bar = 200 μm. K. At 48 hpf, expression domain of cug2 (blue) is not overlapped with that of huC (red), a differentiating neuronal marker. Scale bar = 100 μm. L. cug2-expressing region is almost overlapped with pcna-expressing proliferating zones at 48 hpf. |
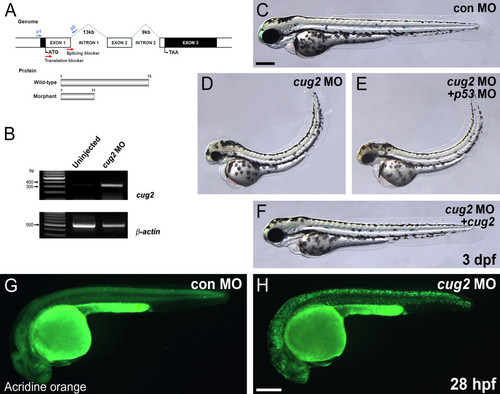
Knock-down analysis of cug2 by morpholinos. A. Genomic structure and MO targeting region (red arrow) of the zebrafish cug2 gene. B. Confirmation of the splice-blocking effect of MO by RT-PCR using p1-p2 primers (in A). Aberrant transcripts were amplified only in cug2 MO-injected embryos. β-actin is the loading control. C-F. In contrast to the control MO (C), cug2 MO-injected embryos (D) display neurodegenerative phenotypes including a flat head, small eyes, pinched midbrain-hindbrain boundary, thin yolk extension, and curved-up body at 3 dpf. Injection of p53 MO (E) did not affect these phenotypes in cug2 morphants, while co-injection of wild-type cug2 mRNA (F) rescued it at 3 dpf. G, H. Detection of cell death in CNS by acridine orange staining of cug2 MO- (H) and control MO-injected (G) embryos at 28 hpf. Scale bars = 250 μm. PHENOTYPE:
|
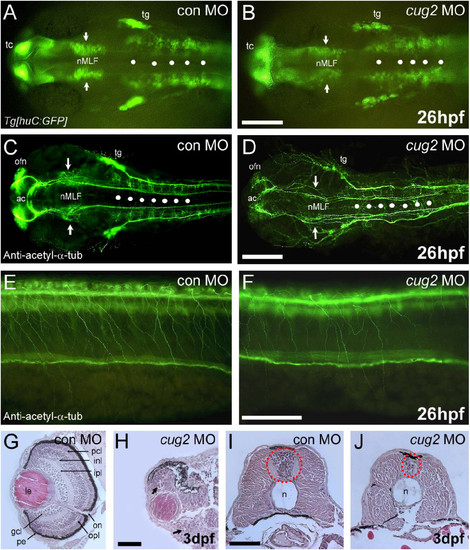
cug2 deficiency causes neurodegeneration in developing embryos. A, B. In huC:GFP transgenic embryos, injection of cug2 MO (B) causes a reduction in the number of neurons in the nucleus of the medial longitudinal fasciculus (nMLF, arrows) and the rhombomere (white spots) compared to control MO (A). Scale bar = 200 μm. C, D. Anti-acetylated α-tubulin staining of the brain of control (C) and cug2 morphants (D). cug2 deficiency causes axonal scaffolding defects in the anterior commissure (ac), olfactory nerve (ofn), nMLF (arrows), and hindbrain commissure (white spots) at 26 hpf. Scale bar = 200 μm. E, F. Anti-acetylated α-tubulin staining of the spinal cord of cug2 morphants (F) at 26 hpf shows reduced arborization in Rohon-Beard (RB) sensory neurons compared to control (E). Scale bar = 100 μm. G-J. Histological sections of control (G, I) and cug2 MO (H, J)-injected embryos at 3 dpf. cug2 morphants exhibit severely disrupted retina layer formation (H) and a much smaller neural tube that contains fewer cells (J). gcl, ganglion cell layer; inl, inner nuclear layer; ipl, inner plexiform layer; le, lens; n, notochord; on, optic nerve; opl, outer plexiform layer; pcl, photoreceptor cell layer; pe, pigmented epithelium. Scale bars = 50 μm. PHENOTYPE:
|
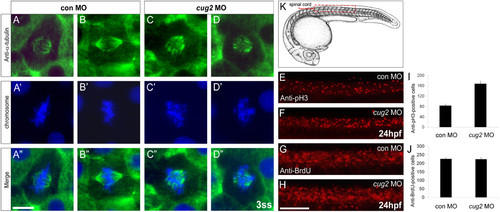
Loss of cug2 function leads to defective mitosis. A-D′′. Anti-α-tubulin immunostaining of the control MO- (A-A′′, B-B′′) and cug2 MO-injected embryos (C-C′′, D-D′′) at the 3-somite stage. cug2 morphants display defective spindle formation and misaligned chromosomes at the metaphase plate (C′, D′). Scale bar = 10 μm. E-H. Lateral views of the spinal cord at 24 hpf. E, F. Anti-phospho-histone H3 immunostaining of control and cug2 morphants. G, H. Anti-BrdU immunostaining of control and cug2 morphants. Scale bar = 100 μm. I, J. Quantification of pH3- (I) and BrdU-positive cells (J) in control and cug2 morphants at 24 hpf (n = 10). The cells were counted from the trunk region, in an area of spinal cord schematically shown (red box) in K. PHENOTYPE:
|
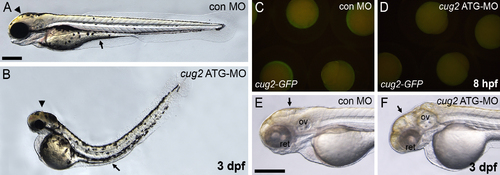
Phenotypes of cug2 translation blocking morpholino (ATG-MO) in zebrafish embryos. A, B. cug2 MO-injected embryo (B) shows developmental defects including flat head, pinched midbrain-hindbrain boundary (arrowhead), thin yolk extension (arrow), and curved-up body. C, D. The translation blocking MO (ATG-MO) specifically inhibits the translation of cug2-GFP mRNA containing its targeting region. E, F. DIC image of PTU-treated cug2 morphant. The cug2 morphant shows retina degeneration and pinched brain structure (arrow) at 3 dpf. ov, otic vesicle; ret, retina. Scale bars = 200 μm. PHENOTYPE:
|
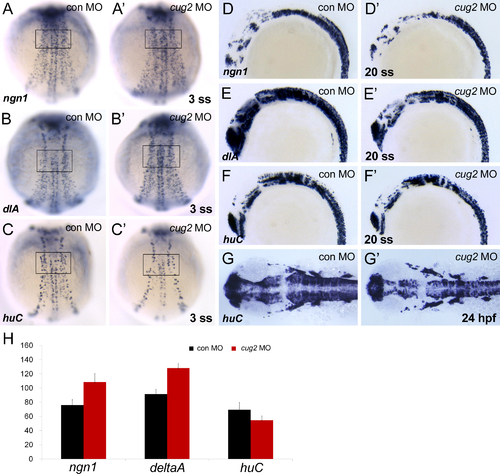
Early neurogenesis in cug2 morphant embryos. A, A′. neurogenin1 (ngn1) expression in control MO- (A) and cug2 MO-injected (A′) embryos at the 3-somite stage (3 ss). The number of ngn1-positive neuronal precursors is increased at neural plate in cug2 MO-injected embryos (80%/n = 20). B, B′. Expression of deltaA (dlA) in control MO- (B) and cug2 MO-injected (B′) embryos at 3 ss. cug2 MO-injected embryos show increase of delta A-expressing neuronal precursor (70%/n = 20). C, C′. huC expression in control MO- (C) and cug2 MO-injected (C′) embryos at 3 ss. The number of huC-positive differentiating neurons is decreased in cug2 MO-injected embryos (77%/n = 26). D-F′. At the 20-somite stage (20 ss), ngn1, deltaA, and huC expression in control MO- (D, E, F) and cug2 MO-injected embryos (D′, E′, F′). During secondary neurogenesis (20 somite-stage), both neuronal precursors (ngn1, delta A) and differentiating neurons (huC) are decreased in cug2 MO-injected embryos. G, G′. Dorsal view at 24 hpf. The number of huC-positive differentiating neurons is dramatically decreased in cug2 morphants (G′). H. Quantification of delta A, ngn1, and huC-positive cells in control and cug2 MO-injected embryos at 3-somite stage in the area indicated in A-C′ (n = 10). |
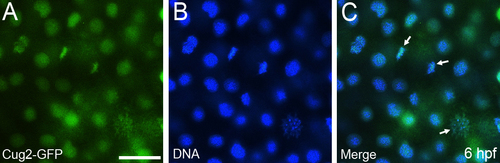
Subcellular localization of Cug2-GFP in zebrafish embryos. Cug2-GFP protein (A) is co-localized with chromatin (B). Mitotic chromosomes are indicated by arrows (C). Scale bar = 30 μm. |