- Title
-
Mutant Prpf31 causes pre-mRNA splicing defects and rod photoreceptor cell degeneration in a zebrafish model for Retinitis pigmentosa
- Authors
- Yin, J., Brocher, J., Fischer, U., and Winkler, C.
- Source
- Full text @ Mol. Neurodegener.
|
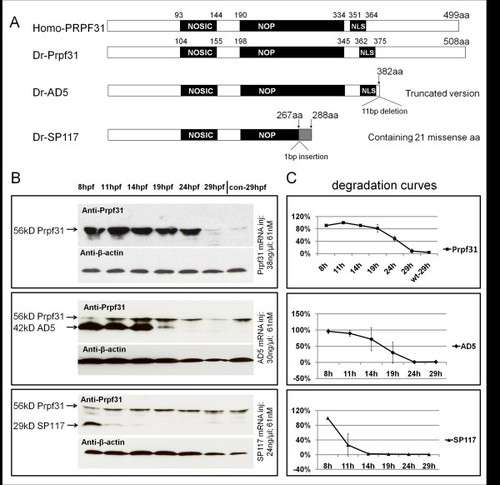
Composition and stability of PRPF31 and its two variants. (A) Schematic diagram of human and zebrafish PRPF31 and two mutants which mimic human AD5 and SP117 variants. Position of NOSIC and NOP domains (for details see text) and predicted nuclear localization signal (NLS) are indicated. The zebrafish AD5 variant is a truncated version (382 aa) to mimic human AD5 which has a 11 bp deletion leading to a frameshift after amino acid 371 (corresponding to zebrafish aa 382; see Additional file 1, Figure S1). SP117 mutation: A 1 bp insertion at 801/802 (in human at 769/770) leads to a frameshift after aa 267 (in human after aa 256), leading to 21 missense aa. (B) Western blot assays showing protein levels of Prpf31, AD5 and SP117 mutant variants over 29 hpf after injection of 61 nM mRNAs, respectively. "con" refers to non-injected wild-type embryos. (C) Degradation curves of Prpf31, AD5 and SP117 proteins (analyzed by Image J). EXPRESSION / LABELING:
|
|
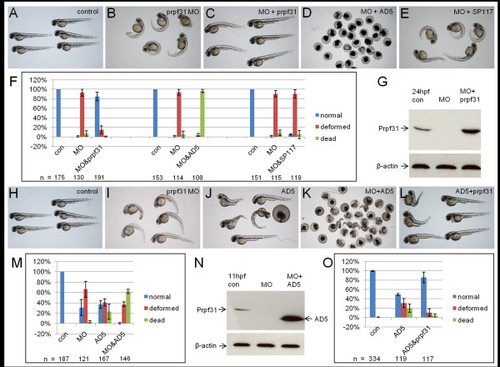
Rescue of prpf31 morphant and AD5 phenotype. (A-G) Rescue of prpf31 morphant phenotype by wild-type prpf31, AD5 and SP117. (A) Non-injected control larvae at 48 hpf. (B) Morphants injected with 10 μg/μl (1.2 mM) prpf31 MO show severe malformations, such as reduced brain and eye size, cardiac edema and curved tails. (C) Full rescue of morphant phenotype after co-injection of 573 ng/μl (0.93 μM) prpf31 mRNA. (D) Embryos co-injected with 437 ng/μl (0.89 μM) AD mRNA show high lethality. (E) Embryos co-injected with 325 ng/μl (0.84 μM) SP117 mRNA showed deformations similar to the situation in morphants. (F) Quantitative analysis of rescue efficiency with different MO/RNA combinations. The mean percentage of embryos in each group was calculated from three independent experiments and standard deviation is shown by error bars. (G) Western blot shows reduced endogenous Prpf31 levels after MO injection. Co-injection of prpf31 mRNA results in elevated Prpf31 levels at 24 hpf. (H-O) Co-injection of AD5 with low doses of prpf31 MO and prpf31 RNA. (H) Control embryos at 48 hpf. (I) Morphants injected with 5 μg/μl prpf31 MO. (J) Embryos injected with 200 ng/μl AD5 mRNA. (K) Embryos co-injected with prpf31 MO and AD5 mRNA. (L) Embryos co-injected with 200 ng/μl AD5 mRNA and 262 ng/μl prpf31 mRNA. (M) Quantitative analysis of embryos injected as in H-K. Co-injection of MO and AD5 mRNA results in a significant increase in lethality. (N) Western blot showing almost undetectable endogenous Prpf31 levels after co-injection of 200 ng/μl AD5 mRNA and 5 μg/μl prpf31 MO, but abundant AD5 protein at 11 hpf. (O) Quantitative analysis of embryos injected with 200 ng/μl AD5 and 262 ng/μl prpf31 mRNA. Co-injection of prpf31 mRNA resulted in a partial rescue of the AD5 induced phenotype. EXPRESSION / LABELING:
PHENOTYPE:
|
|
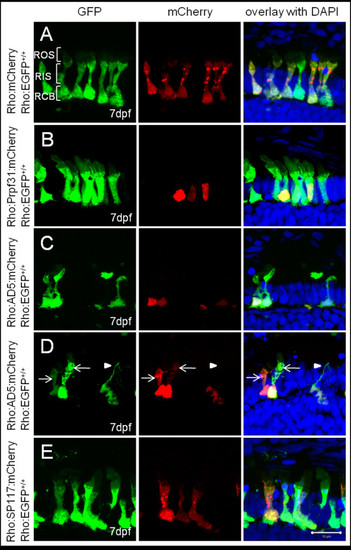
Subcellular localization of wild-type and mutant Prpf31 fusion proteins in rod photoreceptors. Wild-type and mutant Prpf31 fused to mCherry and driven by the rhodopsin promoter were transiently expressed in 7 dpf Tg(Rho:EGFP) larvae in which EGFP is stably expressed in rods and distributed throughout the cytoplasm. (A) Control mCherry was localized in the rod cytoplasm similar as EGFP. (B) Wild-type Prpf31:mCherry was localized in the nuclei of rods. (C) AD5:mCherry was mainly detected in the nuclei of rods similar to wild-type Prpf31. (D) In exceptional cases, AD5:mCherry was also observed in the cytoplasm of individual rods (arrows). Some of the AD5:mCherry positive rods show loss of the outer segment and disintegrated nuclei (arrow head) indicative for rod degeneration. (E) SP117:mCherry was aberrantly localized in the cytoplasm of rods rather than the nucleus. Morphology, however, is normal in SP117 expressing rods. ROS, rod out segment; RIS, rod inner segment; RCB,rod cell body. Left column shows EGFP channel, middle column shows mCherry channel and right column shows overlay together with DAPI stain. |
|
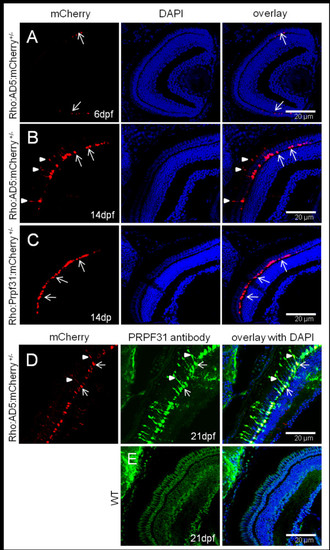
Accumulation of AD5 in rod cytoplasm analyzed in Tg(Rho:AD5:mCherry) larvae at different stages. (A) At 6 dpf, AD5:mCherry was exclusively localized to the nuclei of rods (arrows). (B) In contrast, AD5:mCherry was found also in the inner segments (arrowheads) of rods at 14 dpf. (C) Tg(Rho:Prpf31:mCherry) transgenic larvae at 14 dpf were used as control to show that Prpf31:mCherry is only found in rod nuclei (arrow) but not the cytoplasm. (D) In 21 dpf Tg(Rho:AD5:mCherry) larvae, AD5 protein as detected by PRPF31 antibody (green) was co-localized with mCherry (red) in both the nucleus (arrow) and rod inner segment (arrowhead). (E) In 21 dpf wild-type fish, endogenous Prpf31 protein was localized in all nuclei. Note that imaging exposure in E was extended compared to D to reveal nuclear localization of Prpf31 in all retinal cells. Shorter exposure in D indicates strong expression of transgenic AD5 under control of the rhodopsin promoter in rod photoreceptors. EXPRESSION / LABELING:
PHENOTYPE:
|
|
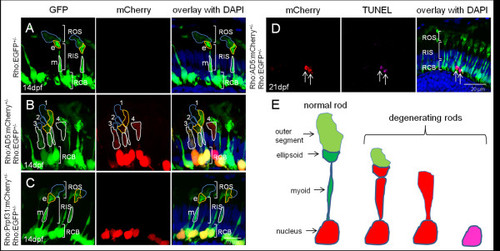
Different degrees of rod photoreceptor degeneration visualized in stable transgenic fish expressing AD5. (A) In control heterozygous Tg(Rho:EGFP)+/- larva (F1) at 14 dpf, abundant EGFP is detected in rod cell bodies and inner segments including the proximal myoid region (white border, m) and distal ellipsoid region (yellow border, e), both of which show distinct morphology. The outer segment (blue border) has faint EGFP. Abbreviations are the same as used in Figure 4. (B). In double transgenic fish, expressing AD5:mCherry, rods show morphological degeneration to different extents at 14 dpf and AD5:mCherry is found to be distributed in the inner segments of many rods. (C) In contrast, double transgenic larvae expressing Tg(Rho:Prpf31:mCherry) show normal rod morphology at 14 dpf. (D) TUNEL assay to detect apoptotic cells in double transgenic fish at 21 dpf expressing AD5:mCherry. Rods undergoing apoptosis lack both outer and inner segments. (E) Model showing different rod degeneration phenotypes observed after AD5 expression. Initially, AD5:mCherry (red) is found in rod nuclei. Later, AD5 can also be found in rod inner segments. Affected rods lose their outer segments, and myoid and ellipsoid fuse. Several rods were observed to enter the final phase of apoptosis when DNA is fragmented and can be detected by TUNEL staining. EXPRESSION / LABELING:
PHENOTYPE:
|
|
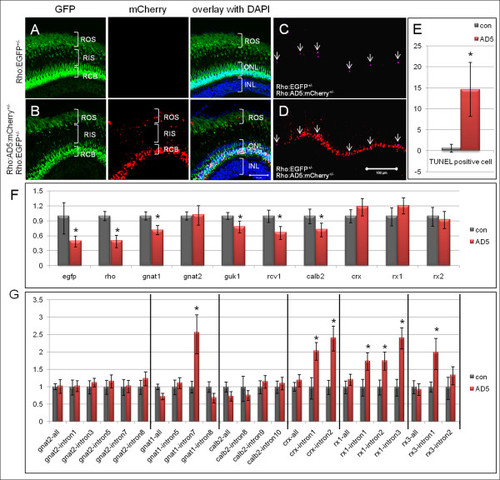
Rod degeneration and splicing defects detected in adult AD5 transgenic fish. (A-E) Rod degeneration in adult AD5 transgenic fish. (A) Adult retina of Tg(Rho:EGFP) control fish at 5 months. EGFP is found in cell bodies (RCB) and outer segments (ROS), and can be seen faintly in inner segments (RIS). (B) Double transgenic fish expressing AD5:mCherry show multiple mCherry positive dots in the rod inner and outer segments, in addition to nuclear mCherry. (C) TUNEL positive apoptotic cells (arrow) in double transgenic fish expressing AD5:mCherry. (D) Overlay of TUNEL signal in image C with AD5:mCherry signal. (E) Number of TUNEL positive cells in double transgenic fish at 5 months expressing AD5:mCherry and Tg(Rho:EGFP) and in control fish (Tg(Rho:EGFP)). (F) qRT-PCR analysis showing gene expression profiles in double transgenic fish retinas expressing AD5:mCherry. 5 months old Tg(Rho:EGFP) transgenic fish retinas were used as control. Transcript numbers of several genes involved in photo-transduction are reduced, including rho, gnat1, guk1, recoverin, and calb2. egfp expression is also reduced, consistent with our histological findings. The cone specific transducin (gnat2) and several retina specific transcription factors (crx, rx1 and rx3) show no significant change. (G) Detection of splicing defects in double transgenic fish retinas (Tg(Rho:EGFP × Rho:AD5:mCherry)) by qRT-PCR. Among the six analyzed transcripts, introns from four genes showed significant stabilization compared to the same introns in control fish (Tg(Rho:EGFP), which includes intron 7 of gnat1, intron 1 and intron 2 of crx, intron 1, intron 2 and intron 3 of rx1, and intron 1 of rx3. In contrast, intron levels for cone specific gene gnat2 showed no significant change when compared to the control. Data were analyzed by T-test. Significant differences are indicated by asterisks. ONL, outer nuclear layer; INL, inner nuclear layer. |

