
|
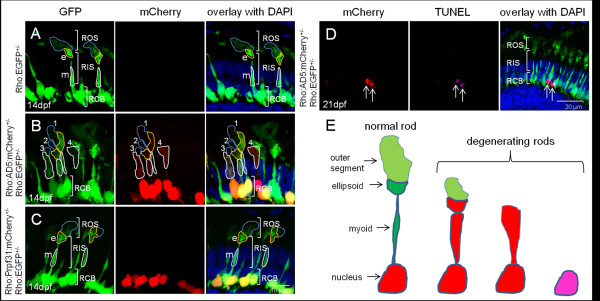
Fig. 6 Different degrees of rod photoreceptor degeneration visualized in stable transgenic fish expressing AD5. (A) In control heterozygous Tg(Rho:EGFP)+/- larva (F1) at 14 dpf, abundant EGFP is detected in rod cell bodies and inner segments including the proximal myoid region (white border, m) and distal ellipsoid region (yellow border, e), both of which show distinct morphology. The outer segment (blue border) has faint EGFP. Abbreviations are the same as used in Figure 4. (B). In double transgenic fish, expressing AD5:mCherry, rods show morphological degeneration to different extents at 14 dpf and AD5:mCherry is found to be distributed in the inner segments of many rods. (C) In contrast, double transgenic larvae expressing Tg(Rho:Prpf31:mCherry) show normal rod morphology at 14 dpf. (D) TUNEL assay to detect apoptotic cells in double transgenic fish at 21 dpf expressing AD5:mCherry. Rods undergoing apoptosis lack both outer and inner segments. (E) Model showing different rod degeneration phenotypes observed after AD5 expression. Initially, AD5:mCherry (red) is found in rod nuclei. Later, AD5 can also be found in rod inner segments. Affected rods lose their outer segments, and myoid and ellipsoid fuse. Several rods were observed to enter the final phase of apoptosis when DNA is fragmented and can be detected by TUNEL staining.