
- Title
-
Identification of an evolutionarily conserved regulatory element of the zebrafish col2a1a gene
- Authors
- Dale, R.M., and Topczewski, J.
- Source
- Full text @ Dev. Biol.
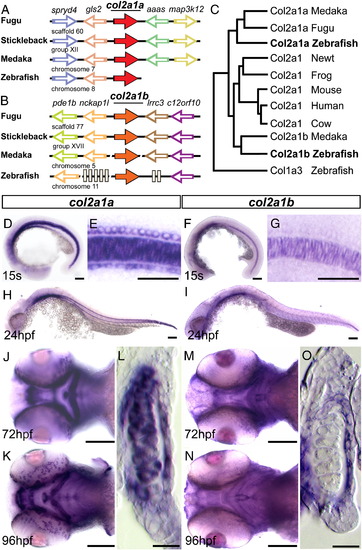
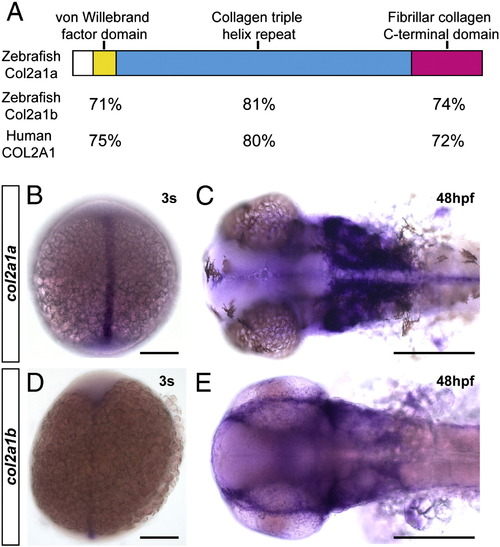
Conservation and expression of zebrafish col2a1 homologues. A–B. Schematic of conserved genomic synteny around the col2a1a (A) and col2a1b (B) genes in fugu, stickleback, medaka, and zebrafish with gene orientation marked by the direction of the arrows. Location of the genomic region is marked below. The angled slices through line denote gaps in the published sequence and grey boxes demark genes not conserved between teleosts. C. Phylogenic tree of the protein sequence between vertebrate col2a1 homologues. D–O. Developmental expression patterns of col2a1a (D, E, H, J–L) and col2a1b (F, G, I, M–O) genes. D, F. Lateral view of a 15 somite stage embryo. E. Magnification of trunk region of the embryo shown on panel (D) with expression in the floor plate, notochord, and hypochord. G. Magnification of trunk of the embryo (F) showing only notochord expression. H, I. Lateral view of 24 hpf embryo. J, M. Ventral view of 72 hpf head. K, N Ventral view of 96 hpf head. L, O. Transverse section through ceratohyal cartilage and surrounding tissue of a 96 hpf embryo. Scale bars = 50 μm except for E, G, L and O = 25 μm. EXPRESSION / LABELING:
|
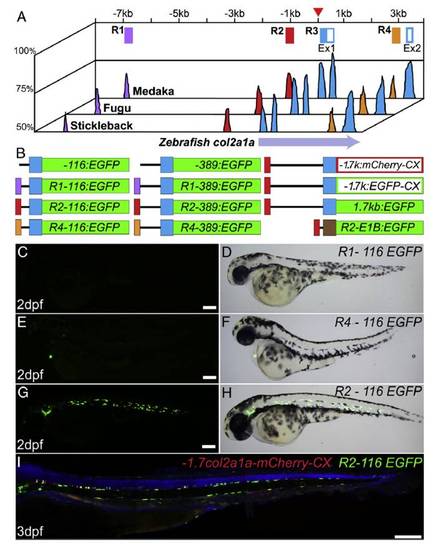
Identification and characterization of evolutionally conserved elements of the col2a1a gene in teleosts. A. Schematic of an mVISTA plot comparing the 12 kb sequence around the transcriptional start site (red arrowhead) of the zebrafish col2a1a gene with corresponding regions of medaka, fugu, or stickleback. The X-axis represents genomic distance in kb away from the presumptive +1 transcriptional start site (red arrow head), the Y-axis represents percent homology over a 10 base pair window. Conserved domains used for regulatory analysis are schematized and color coded above the graph. Open boxes represent the coding sequence. B. Reporter constructs created during this study, with the color scheme of the regulatory elements as on panel A. C, E, G, Fluorescent and D, F, H, Nomarski image of embryos injected with plasmid DNA C-D R1-116EGFP, E-F R4-116EGFP, and G-H R2-116EGFP. I. Representative 3 dpf embryo injected with both R2-116bp:EGFP and -1.7col2a1a:mCherry-caax counterstained with DAPI. Scale bars=200 μm. |
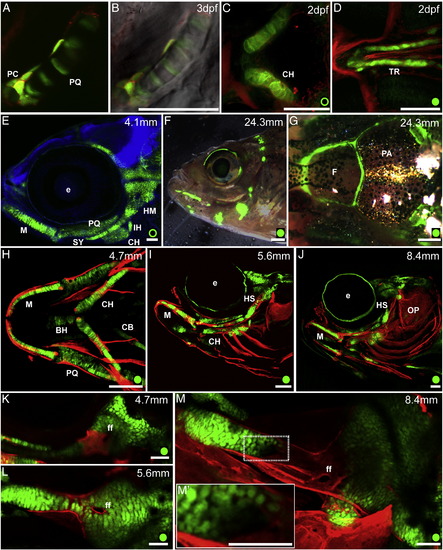
Regulatory element R2 of the col2a1a gene drives expression in the craniofacial cartilages. A. Fluorescent and B. merged with Nomarski images of the palatoquadrate and surrounding perichondrium of an embryo injected with DNA for both R2-E1b:EGFP and - 1.7col2a1a:mCherry-caax. C–D. Ventral view of 2 dpf embryos counterstained with wheat germ agglutinin conjugated to Alexa Fluor 647. A. Tg(1.7c2a1a:mGFP) is expressed in the ceratohyal. B. Tg(R2c2a1a:GFP) expression in the trabeculae. E. Lateral view of DAPI stained 4.1 mm SL Tg(1.7c2a1a:mGFP) embryo. F. Lateral view and G. dorsal view of head of adult Tg(R2c2a1a:GFP). H–J. Developmental time series of live larval stage Tg(R2c2a1a:GFP) fish stained with Alizarin red. H. Ventral view, I–J. Semi-lateral view. K–M. Lateral view of hyomandibular cartilages of H–J showing the process of ossification initiated ventral to facial nerve foramen. M2. Magnification of chondrocytes positive for EGFP as they begin the process of hypotrophy. Cartilages: BH, basihyal; CB, ceratobranchials; CH, ceratohyal; HM, hyomandibula; IH, interhyal joint; M, Meckel′s, PQ, palatoquadrate; SY, symplectic; TR, trabeculae. Bones: F, frontal; OP, opercula; PA, parietal. Other: e, eye; ff, facial nerve foramen; pc, perichondrium; Scale bars: A–E, K–M = 50 μm, F = 500 μm, G = 400 μm, H–J = 150 μm. Here and throughout the paper a green circle marks Tg(1.7c2a1a:mGFP) and a green disk indicates the Tg(R2c2a1a:GFP). |
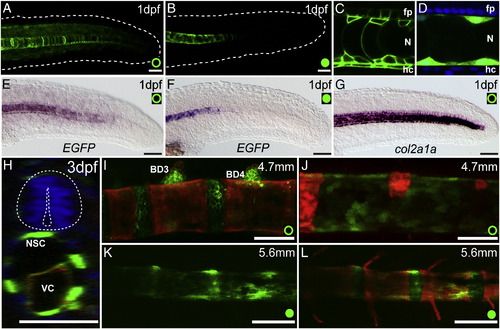
Both transgenic lines drive expression in the developing notochord and other midline structures. A–B. Projection of the confocal image stacks of the posterior tail region of 1 dpf, lateral view. Outline of embryo is marked by white doted line. A. Tg(1.7c2a1a:mGFP) and B. Tg(R2c2a1a:GFP) embryos. C. Lateral view of mid-trunk of Tg(1.7c2a1a:mGFP) embryo showing EGFP expression (green) in the floor plate, hypochord, and notochordal sheath and vacuolated cells. D. Lateral view of mid-trunk of Tg(R2c2a1a:GFP) embryo showing EGFP expression (green) only in notochordal sheath cells. DAPI stained nuclei (blue) indicate position of the floor plate and hypochord. E–G. Lateral view of in situ hybridizations for EGFP (E–F) or col2a1a (G) expression at 1 dpf in (E, G) Tg(1.7c2a1a:mGFP) and (F) Tg(R2c2a1a:GFP). H. Orthogonal cross section of the confocal image Z-stack of 3 dpf embryo injected with R2-116bp:EGFP (green) and - 1.7col2a1a:mCherry-caax (red) and counterstained with DAPI. Neural tube is outlined with white doted line. I–J. Notochord ossification of approximately a 14 dpf embryo. Anterior most (I) and posterior most (J) notochord ossification centra stained with Alizarin red. K–L. Approximately 21 dpf Tg(R2c2a1a:GFP) demonstrates transgenic activity is strongly reduced where centra are formed, but maintained in the region that will give rise to the intervertebral discs. Scale bar = 50 μm. |
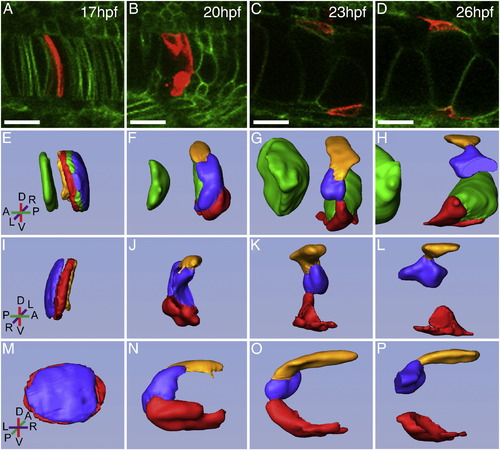
Formation of the epithelial notochord sheath cells. (A–D) Confocal images of Tg(β-actin:HRAS-EGFP)vu119 fish injected with - 1.7kbcol2a1a:mCherry-CAAX plasmid to track the snapping, retraction, and spreading process of NSCs over the course of 9 h. (E–P) 3D rendering of labeled cells from confocal images. (E–H) Lateral right and I–L. left lateral view with green vacuolated cells removed. (M–P) posterior view along notochord axis. Coordinates indicate anterior/posterior (A/P), dorsal/ventral (D/V), and left/right (L/R) axes. Scale bar = 20 μm. |
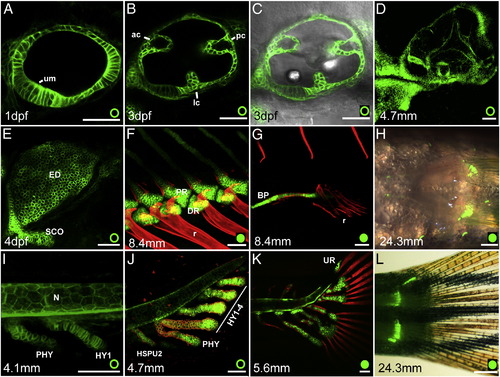
Expression of the reporter proteins in the developing ear and fin structures. A–D. Developmental time series of ear development from 1 dpf to 14 dpf (~ 4.7 mm SL). E. 4 dpf zebrafish pectoral fin. F. Anal and G–H. pelvic fins. I–L. Formation of the skeleton of the caudal fin support from 7 dpf till adulthood. ac, anterior canal; BP, basipterygium; DR, distal radial; ED, endochondrial disc; HY, hypurals; HSPU, hemal spines. lc, lateral canal; N, notochord; pc, posterior canal; PHY, parhypural; PR, proximal radial; R, ray; SCO, scapulocoracoid; UR, urostyle, um; utricular macula; Scale Bars = 50 μm except for H, L = 2 mm. |
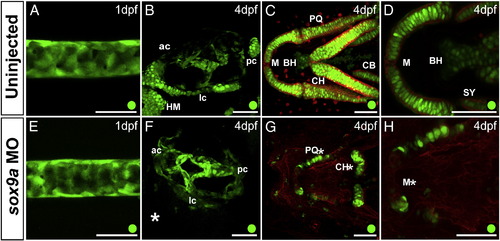
Loss of Sox9a affects R2 activity in cartilage, but not in ear or notochord. A–D. Uninjected sibling and E–H. sox9a morphant of Tg(R2c2a1a:GFP). A, E. Lateral view of the notochord of 1 dpf embryo. B, F. Lateral view of 4 dpf embryo ear. C, G. Ventral view of craniofacial cartilage of 4 dpf embryo. D, H. Higher magnification of C,G. (respectively) focused on Meckel′s Cartilage. ac, anterior canal; BH, basihyal; CB, ceratobranchials; CH, ceratohyal; HM, hyomandibular; lc, lateral canal; M, Meckel′s cartilage; pc, posterior canal; PQ, palatoquadrate; SY, symplectic. Scale bars = 50 μm. |
EXPRESSION / LABELING:
|
Reprinted from Developmental Biology, 357(2), Dale, R.M., and Topczewski, J., Identification of an evolutionarily conserved regulatory element of the zebrafish col2a1a gene, 518-31, Copyright (2011) with permission from Elsevier. Full text @ Dev. Biol.