
|
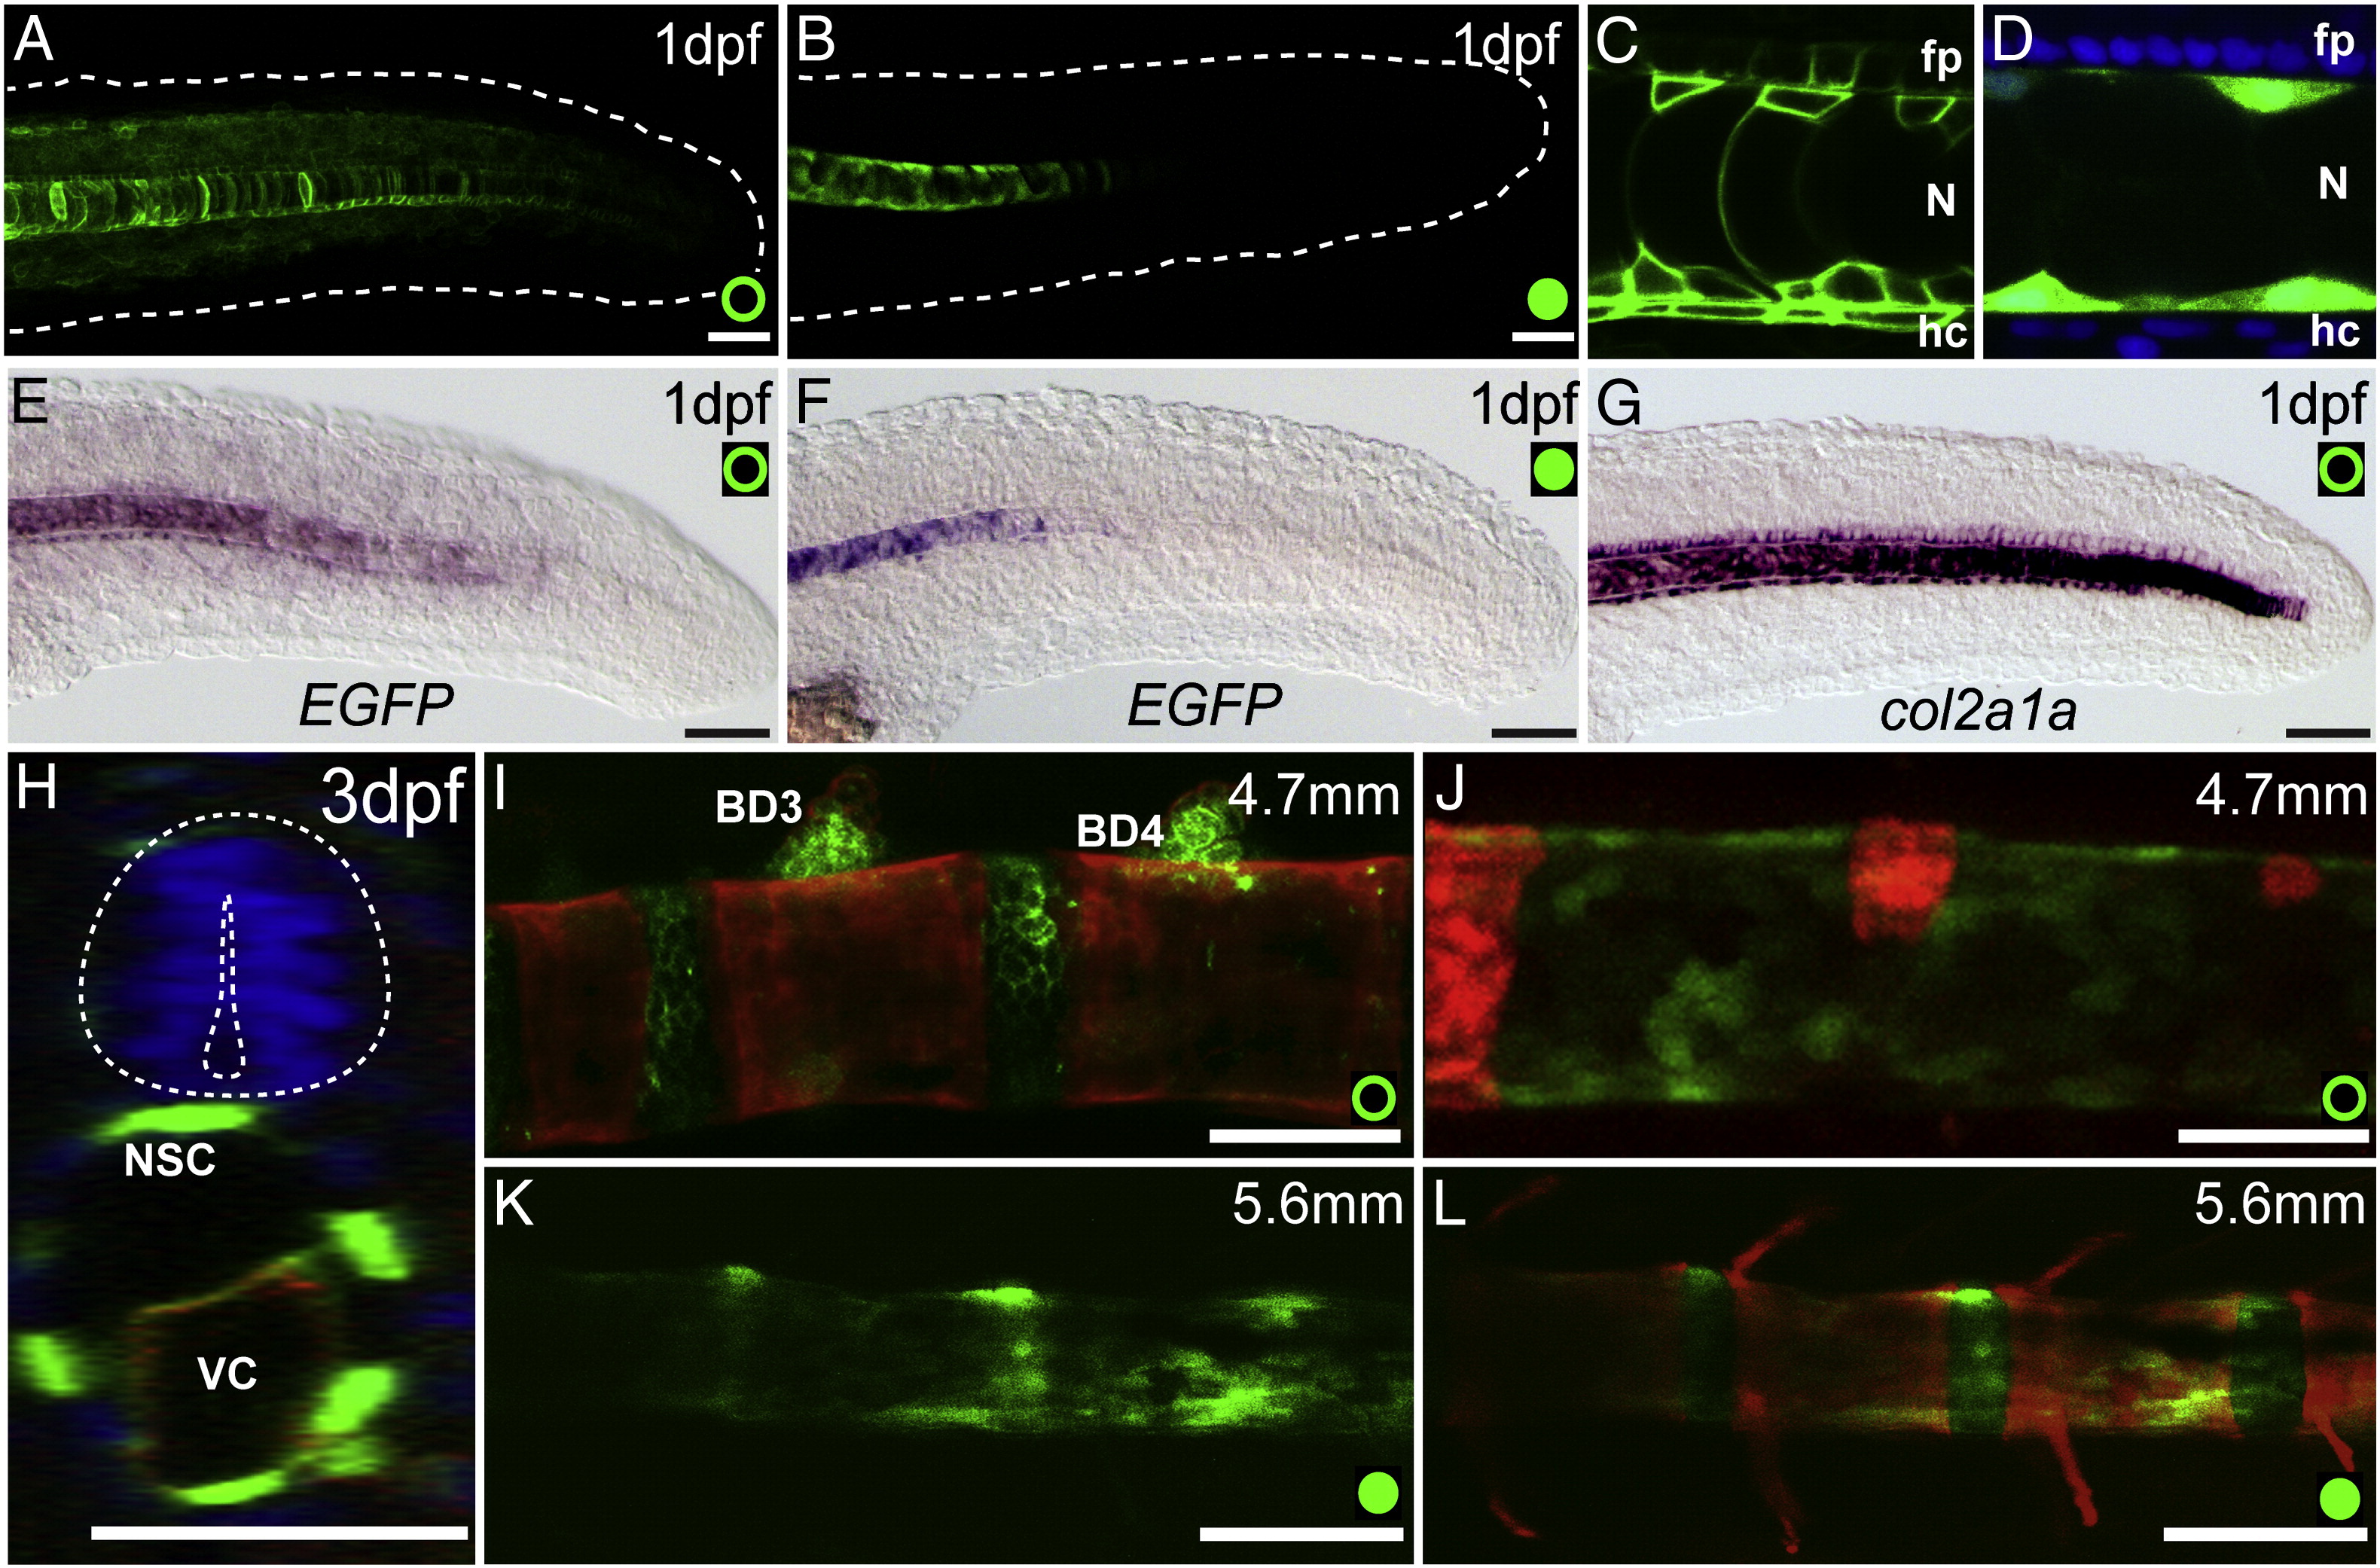
Fig. 4 Both transgenic lines drive expression in the developing notochord and other midline structures. A–B. Projection of the confocal image stacks of the posterior tail region of 1 dpf, lateral view. Outline of embryo is marked by white doted line. A. Tg(1.7c2a1a:mGFP) and B. Tg(R2c2a1a:GFP) embryos. C. Lateral view of mid-trunk of Tg(1.7c2a1a:mGFP) embryo showing EGFP expression (green) in the floor plate, hypochord, and notochordal sheath and vacuolated cells. D. Lateral view of mid-trunk of Tg(R2c2a1a:GFP) embryo showing EGFP expression (green) only in notochordal sheath cells. DAPI stained nuclei (blue) indicate position of the floor plate and hypochord. E–G. Lateral view of in situ hybridizations for EGFP (E–F) or col2a1a (G) expression at 1 dpf in (E, G) Tg(1.7c2a1a:mGFP) and (F) Tg(R2c2a1a:GFP). H. Orthogonal cross section of the confocal image Z-stack of 3 dpf embryo injected with R2-116bp:EGFP (green) and - 1.7col2a1a:mCherry-caax (red) and counterstained with DAPI. Neural tube is outlined with white doted line. I–J. Notochord ossification of approximately a 14 dpf embryo. Anterior most (I) and posterior most (J) notochord ossification centra stained with Alizarin red. K–L. Approximately 21 dpf Tg(R2c2a1a:GFP) demonstrates transgenic activity is strongly reduced where centra are formed, but maintained in the region that will give rise to the intervertebral discs. Scale bar = 50 μm.
Reprinted from Developmental Biology, 357(2), Dale, R.M., and Topczewski, J., Identification of an evolutionarily conserved regulatory element of the zebrafish col2a1a gene, 518-31, Copyright (2011) with permission from Elsevier. Full text @ Dev. Biol.