
|
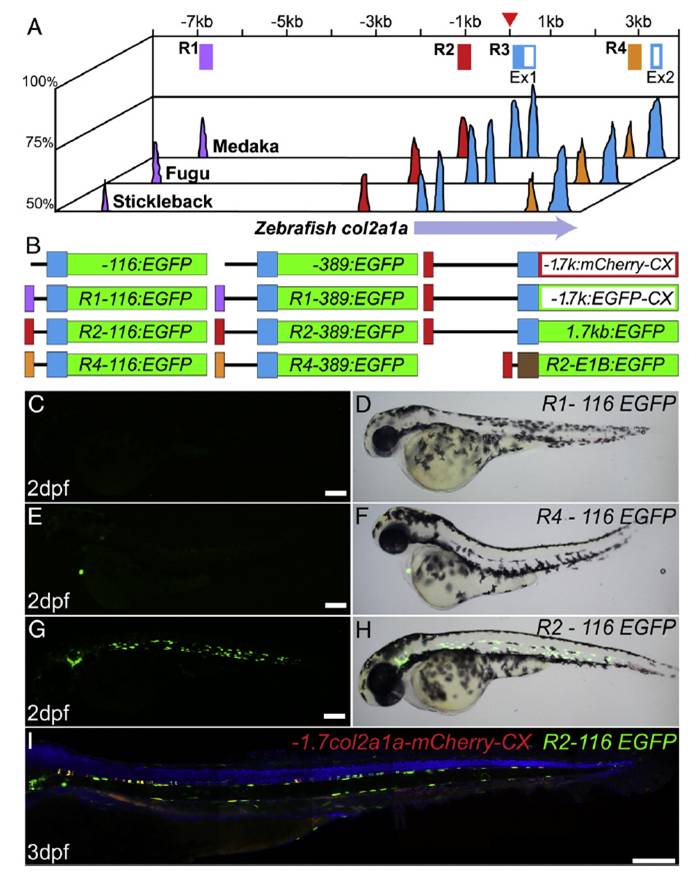
Fig. 2 Identification and characterization of evolutionally conserved elements of the col2a1a gene in teleosts. A. Schematic of an mVISTA plot comparing the 12 kb sequence around the transcriptional start site (red arrowhead) of the zebrafish col2a1a gene with corresponding regions of medaka, fugu, or stickleback. The X-axis represents genomic distance in kb away from the presumptive +1 transcriptional start site (red arrow head), the Y-axis represents percent homology over a 10 base pair window. Conserved domains used for regulatory analysis are schematized and color coded above the graph. Open boxes represent the coding sequence. B. Reporter constructs created during this study, with the color scheme of the regulatory elements as on panel A. C, E, G, Fluorescent and D, F, H, Nomarski image of embryos injected with plasmid DNA C-D R1-116EGFP, E-F R4-116EGFP, and G-H R2-116EGFP. I. Representative 3 dpf embryo injected with both R2-116bp:EGFP and -1.7col2a1a:mCherry-caax counterstained with DAPI. Scale bars=200 μm.
Reprinted from Developmental Biology, 357(2), Dale, R.M., and Topczewski, J., Identification of an evolutionarily conserved regulatory element of the zebrafish col2a1a gene, 518-31, Copyright (2011) with permission from Elsevier. Full text @ Dev. Biol.