
- Title
-
Genetic visualization with an improved GCaMP calcium indicator reveals spatiotemporal activation of the spinal motor neurons in zebrafish
- Authors
- Muto, A., Ohkura, M., Kotani, T., Higashijima, S.I., Nakai, J., and Kawakami, K.
- Source
- Full text @ Proc. Natl. Acad. Sci. USA
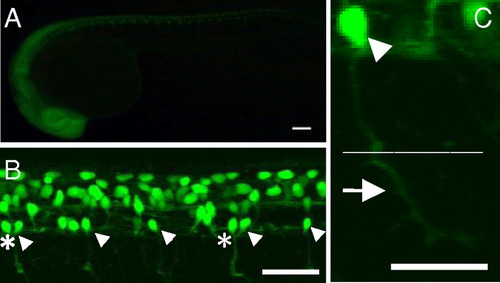
GFP expression in the SAIGFF213A;UAS:GFP double transgenic embryos. (A) A side view at 24 hpf. GFP is expressed in the central nervous system. (Scale bar, 100 μm.) (B) A side view of the spinal cord at 24 hpf observed with a confocal microscope. Arrowheads indicate CaP motor neurons. In some cases, two CaP neurons are found in one spinal segment (asterisks). (Scale bar, 100 μm.) (C) The soma (arrowhead) and axon of the GFP-expressing single CaP neuron at 24 hpf. The CaP neurons project their axons to the ventral muscle (arrow). Dotted line shows the boundary between dorsal and ventral muscles. (Scale bar, 50 μm.) |
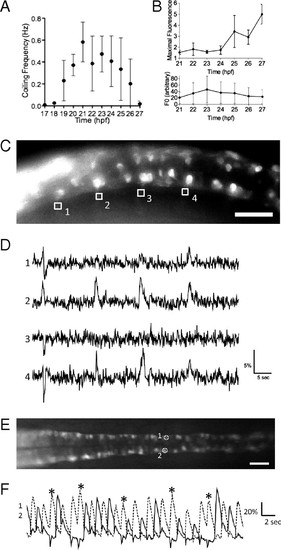
Imaging of the activity of CaP motor neurons in the SAIGFF213A;UAS:GCaMPHS double-transgenic embryo during spontaneous contractions. (A) Time course of the frequency of spontaneous contractions between 17 and 27 hpf. (B) The increase of the maximal fluorescence changes (Upper) and the fluorescence at the resting state (Lower) of GCaMP-HS in the soma of the CaP motor neuron between 21 and 27 hpf. Means and SD are shown (n = 5). (C) A side view of the double-transgenic embryo at 18.5 hpf. Anterior to the left. GCaMP fluorescence was detected in the CaP neurons and some other neurons. The axons of the CaP neurons were used as ROI (1–4). (Scale bar, 50 μm.) (D) The fluorescence changes in the ROI-1, -2, -3, and -4 are shown as graphs. Downward peaks at the left ends of ROI-1, -2, and -3 are artifacts caused by the movement of the embryo. (E) A dorsal view of the SAIGFF213A;UAS:GCaMPHS4A embryo at 24 hpf. Anterior to the left. The CaP neurons that are circled and numbered were used as ROIs. (Scale bar, 200 μm.) (F) The fluorescence changes in the ROI-1 (dotted line) and ROI-2 (solid line). Two consecutive peaks detected in ROI-2 are marked with asterisks. |
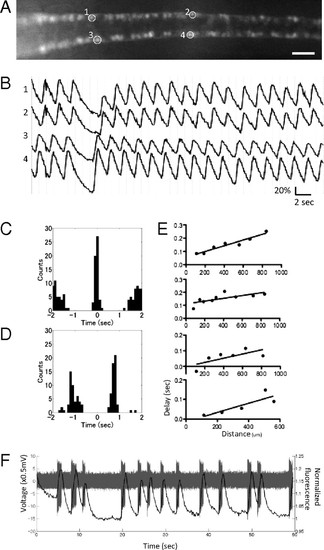
Spatiotemporal patterns of activation of the CaP motor neurons. (A) A dorsal view of the SAIGFF213A;UAS:GCaMPHS4A embryo at 24 hpf treated with 100 μM D-tubocurarine. (Scale bar, 200 μm.) (B) The fluorescence changes in ROIs in A. (C) Cross-correlogram of the ipsilateral CaP neurons. (D) Cross-correlogram of the contralateral CaP neurons. (E) The averaged timing of the peaks of the ipsilateral CaP neurons located in a rostral (Left)-to-caudal (Right) sequence. Data from four embryos are shown. (F) A whole cell-patch recording and simultaneous calcium imaging of the CaP neurons during spontaneous contractions. Action potentials (gray) and calcium signals (black) are shown. |
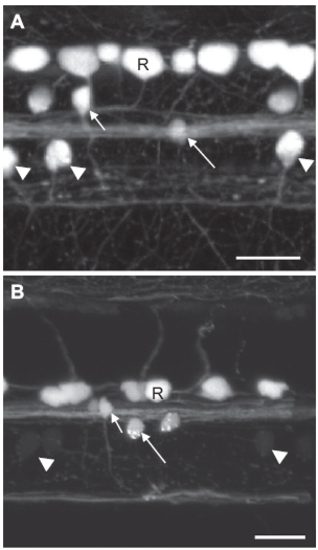
GFP expression in the SAIG213A;UAS:GFP fish at 2 days postfertilization (dpf) and 7 dpf. (A) A confocal image of the spinal neurons at 2 dpf. (B) A confocal image of the spinal neurons at 7 dpf. Note that GFP fluorescence is greatly reduced in CaP neurons. Arrowheads: CaPs; Short and long arrows: two classes of interneurons; R: Rohon-Beard neurons. (Scale bar, 20 μm.) |
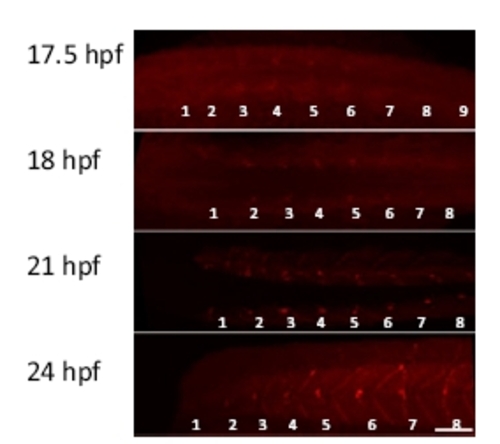
Development of neuromuscular junctions. Fluorescently labeled α-bungarotoxin was used to label neuromuscular junctions during 17.5 to 24 hours postfertilization (hpf). Dorsal views (17.5 to 21 hpf) and a lateral view (24 hpf) are shown. Myotomes are numbered from rostral to caudal (1–9). (Scale bar, 50 μm.) |