
Fig. 3
- ID
- ZDB-FIG-110719-22
- Publication
- Muto et al., 2011 - Genetic visualization with an improved GCaMP calcium indicator reveals spatiotemporal activation of the spinal motor neurons in zebrafish
- Other Figures
- All Figure Page
- Back to All Figure Page
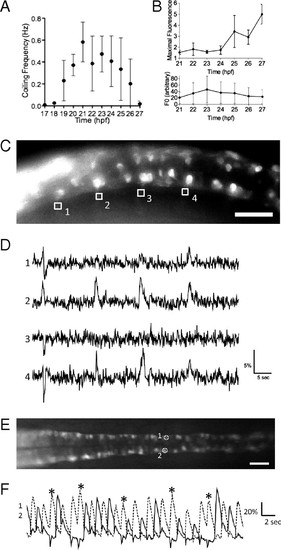
Imaging of the activity of CaP motor neurons in the SAIGFF213A;UAS:GCaMPHS double-transgenic embryo during spontaneous contractions. (A) Time course of the frequency of spontaneous contractions between 17 and 27 hpf. (B) The increase of the maximal fluorescence changes (Upper) and the fluorescence at the resting state (Lower) of GCaMP-HS in the soma of the CaP motor neuron between 21 and 27 hpf. Means and SD are shown (n = 5). (C) A side view of the double-transgenic embryo at 18.5 hpf. Anterior to the left. GCaMP fluorescence was detected in the CaP neurons and some other neurons. The axons of the CaP neurons were used as ROI (1–4). (Scale bar, 50 μm.) (D) The fluorescence changes in the ROI-1, -2, -3, and -4 are shown as graphs. Downward peaks at the left ends of ROI-1, -2, and -3 are artifacts caused by the movement of the embryo. (E) A dorsal view of the SAIGFF213A;UAS:GCaMPHS4A embryo at 24 hpf. Anterior to the left. The CaP neurons that are circled and numbered were used as ROIs. (Scale bar, 200 μm.) (F) The fluorescence changes in the ROI-1 (dotted line) and ROI-2 (solid line). Two consecutive peaks detected in ROI-2 are marked with asterisks. |