
- Title
-
The Rho kinase Rock2b establishes anteroposterior asymmetry of the ciliated Kupffer's vesicle in zebrafish
- Authors
- Wang, G., Cadwallader, A.B., Jang, D.S., Tsang, M., Yost, H.J., and Amack, J.D.
- Source
- Full text @ Development
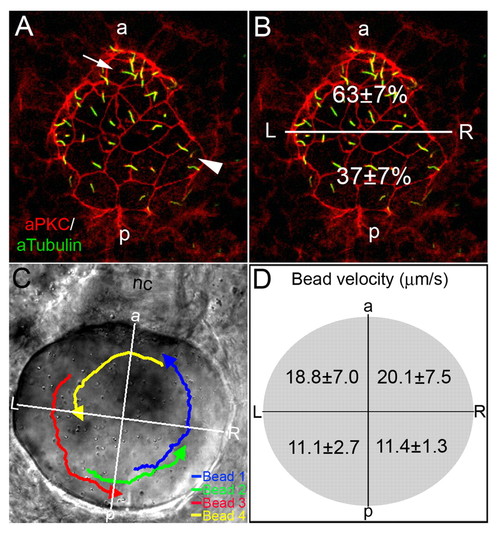
AP asymmetry in KV. (A,B) Fluorescent immunostaining of KV cells at 8-SS with aPKC (red) and acetylated tubulin (green) antibodies. To visualize individual cells, only the dorsal surface of KV is shown. Cells in the posterior region of KV had large apical surfaces (arrowhead), whereas cells in the anterior region had smaller apical surfaces (arrow). Counting all KV cilia in wild-type embryos (n=13), revealed a significant difference (P=3.60E-5) in the positioning of cilia with 63% located in the anterior half of KV and 37% are in the posterior region (B). (C,D) Tracking fluorescent beads injected into KV shows fluid flow velocity is asymmetric. (C) Paths of beads and the AP and LR axes of KV, relative to the notochord, have been superimposed onto a DIC image of KV. (D) The average velocity of 23 beads from 5 wild-type embryos in quadrants of KV indicated that flow was significantly stronger from right to left in the anterior region than in the posterior of KV (P<0.05). Numbers are averages ± one s.d. L, left; R, right; a, anterior; p, posterior; nc, notochord. EXPRESSION / LABELING:
|
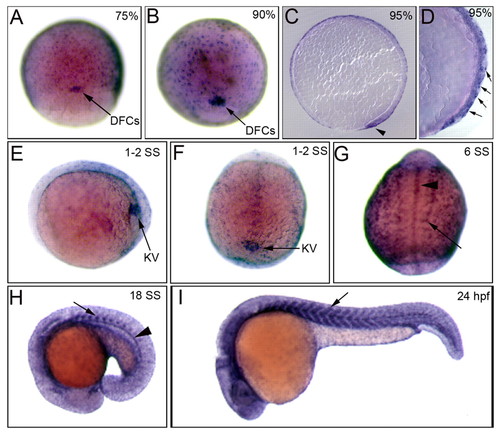
rock2b is expressed in the DFC/KV cell lineage. (A,B) Whole embryo RNA in situ hybridization staining shows rock2b is expressed in DFCs (arrows) and the enveloping layer at 75% (A), 90% epiboly (B). (C,D) Sagittal sections of stained embryos at 95% epiboly show rock2b expression in DFCs (arrowhead) and the EVL (arrows). (E,F) During early SSs, rock2b is detected in KV cells (arrow). (E) is a lateral view at 1- to 2-SS and (F) is a dorsal view. (G-I) During later somitogenesis, rock2b is expressed in somites (arrows) and midline structures including the hypochord and notochord (arrowheads). EXPRESSION / LABELING:
|
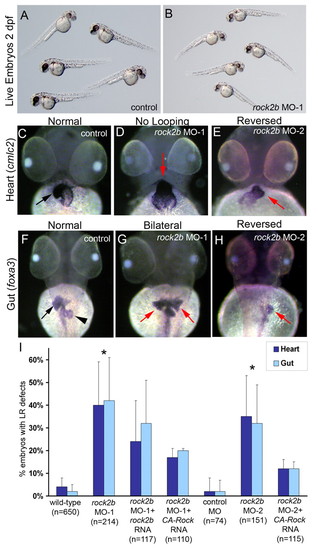
rock2b knockdown alters heart and gut laterality. (A,B) Embryos injected with a low dose of rock2b MO-1 (B) appeared similar to wild-type controls (A) at 2 dpf, (C-E) Analysis of heart looping at 2 dpf by cmlc2 RNA in situ hybridizations revealed normal rightward looping in control embryos (arrow in C), and LR defects including a failure of heart looping (arrow in D) and reversed looping (arrow in E) in rock2b MO embryos. (F-H) foxa3 was used to label liver (arrow) and pancreas (arrowhead) at 2 dpf. Controls showed normal asymmetric orientation of these organs (F), whereas they were often bilaterally symmetric (arrows in G) or in a reversed position (arrow in H) in rock2b MO embryos. (I) The percentage of embryos injected with MO or MO + rescue mRNA which showed heart and gut laterality defects are presented in the graph and in Table S1 in the supplementary material. *Significantly different (P<0.05) from wild-type and control MO embryos. Error bars indicate +1 s.d. n=number of embryos analyzed. |
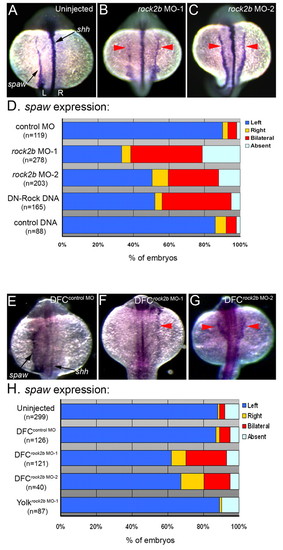
Rock2b function in DFC/KV cells is required for normal asymmetric southpaw expression. (A-C) spaw is normally expressed in left LPM in control embryos (A) at 16- to 18-SS. In contrast, spaw expression was often bilateral in rock2b MO embryos (red arrows in B,C). shh expression (see arrow in A) indicated that embryonic midline structures were intact. (D) The frequency of altered spaw expression (right, bilateral or absent) in control embryos and embryos injected with rock2b MO or DNA encoding DN-Rock proteins. (E-G) spaw expression was altered in DFCrock2b MO embryos (F,G), whereas normal left-sided expression was observed in most control DFCcontrol MO embryos (E). (H) The percentage of DFCrock2b MO and control embryos with spaw defects. n=number of embryos analyzed. EXPRESSION / LABELING:
PHENOTYPE:
|
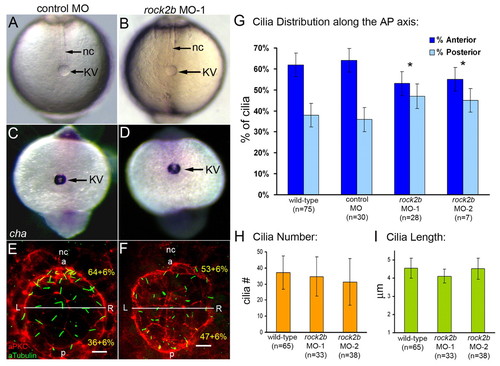
rock2b knockdown disrupts AP asymmetric arrangement of KV cilia without inhibiting KV lumen formation or ciliogenesis. (A,B) Light micrographs at 8-SS show KV lumen (arrow) appeared similar in control MO (A) and rock2b MO (B) embryos. Surrounding tailbud tissue and nc also appeared similar. (C,D) Normal cha expression around KV (arrow) in control MO (C) and rock2b MO (D) embryos at 10- to 12-SS. (E,F) Fluorescent immunostaining of KV using aPKC and acetylated tubulin antibodies in control MO (E) and rock2b MO (F) embryos at 8-SS. KV was bisected into anterior and posterior regions using the position of the nc. (G) The average AP distribution ± 1 s.d. is shown (also shown in yellow in E and F). *The AP distribution of ciliated cells was significantly different (P<0.01) from controls. (H,I). There were no statistical differences (P>0.05) in cilia number or length among wild-type (37±10 cilia; 4.5±0.5 μm), rock2b MO-1 (34±12 cilia; 4.1±0.4 μm) and rock2b MO-2 (32±15 cilia; 4.5±0.6 μm) embryos. Scale bars: 10 μm. Error bars: 1 s.d. nc, notochord; a, anterior; p, posterior; L, left; R, right. n=number of embryos analyzed. EXPRESSION / LABELING:
PHENOTYPE:
|
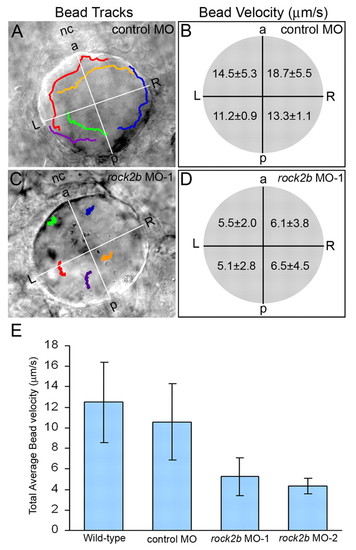
Asymmetric KV fluid flow is disrupted by rock2b knockdown. (A,C) Tracks of fluorescent beads superimposed on DIC images of KV. Beads followed a counterclockwise path in control MO embryos (A), but this directional flow was lost in rock2b MO embryos (C). (B,D) Measurements of bead velocities in quadrants of KV showed that flow was stronger in the anterior region of control MO embryos (B; n=28 beads from six embryos), but velocities were similar in all quadrants of rock2b MO embryos (D; n=30 beads from seven embryos). (E) Total average flow velocity was reduced in rock2b MO embryos relative to controls. Average velocity is shown for uninjected (n=35 beads from seven embryos), control MO (n=30 beads from six embryos), rock2b MO-1 (n=70 beads from 14 embryos) and rock2b MO-2 (n=19 beads from four embryos) embryos. Error bar: 1 s.d. nc, notochord; a, anterior; p, posterior; L, left; R, right. PHENOTYPE:
|
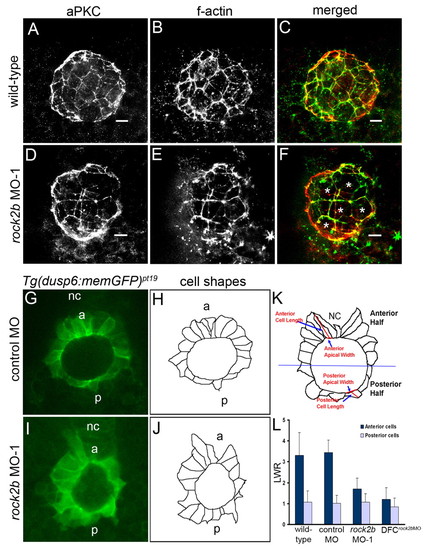
rock2b knockdown alters KV cell shapes. (A-F) KV cells at 8-SS double fluorescently labeled with aPKC antibodies (A,D) and phalloidin (B,E) to detect apical membrane and filamentous actin (f-actin), respectively. Apical actin structures were present and co-localized with aPKC similarly in wild-type (A-C) and rock2b MO-1 (D-F) embryos, but the architecture of KV appeared different in rock2b MO-1 embryos, in which more KV cells had large apical surfaces (examples are marked by * in F). (G,I) Confocal images of memGFP-labeled KV cells in live Tg(dusp6:memGFP)pt19 transgenic embryos injected with control MO (G) or rock2b MO-1 (I). (H,J) Diagrams show KV cell shapes traced from confocal images. (K) Diagram of KV cells in a wild-type embryo, with a description of how the LWR was measured in anterior and posterior KV cells. (L) The average LWR for wild-type (n=12 embryos) control MO (n=5) and rock2b MO-1 (n=15) and DFCrock2b MO-1 (n=4) embryos. Scale bars: 10 μm. Error bars: 1 s.d. nc, notochord; a, anterior; p, posterior. EXPRESSION / LABELING:
PHENOTYPE:
|

Dose-dependent rock2b MO knockdown phenotypes. (A-C) Live embryos at 2 dpf. A high dose (0.8 ng) of rock2b MO-1 caused severe axis elongation defects (C) relative to a low (0.4 ng) MO dose (B) and uninjected controls (A). (D) RT-PCR was used to determine efficacy of rock2b MO-1 that targets splicing of exons 3-4 of rock2b mRNA. The 0.4 ng MO dose resulted in a partial loss of spliced transcripts, whereas the 0.8 ng dose resulted in greater depletion. β-Actin was amplified as a control. rock2b exon-intron structure and the rock2b MO-1 target site are shown in the diagram in D. (E-G) Similar dose-dependent axis elongation defects were observed in rock2b MO-2 injected embryos at 2 dpf (F,G), relative to control MO injected embryos (E). |
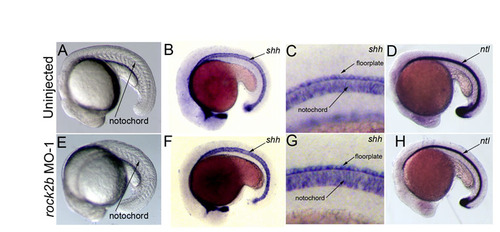
Midline structures are intact in rock2b MO knockdown embryos. (A,E) Bright-field images of uninjected control (A) and rock2b MO (E) embryos, showing normal notochord formation. (B,C,F,G) RNA in situ hybridization analysis showed shh expression in the notochord and floorplate of the neural tube was similar in uninjected (n=71/71) (B,C) and rock2b MO (n=111/112) (F,G) embryos. (C,G) High-magnification views of the midline in B,F, respectively. (D,H) Expression of no tail (ntl) was contiguous in the notochords of uninjected (n=83/83) (D) and rock2b MO (n=86/87) (H) embryos. |

Mosaic expression of dominant-negative Rho kinase disrupts LR development. (A,B) The majority of embryos (93%, n=82) injected with 20 pg of control plasmid encoding yellow fluorescent protein (YFP) appeared normal at 2 dpf, including normal axis elongation (A). Most embryos injected with 20 pg of DNA encoding dominant-negative Rho kinase (DN-Rock) also showed normal axis elongation (75%, n=70), but some embryos developed mild (16%, n=70) or severe (9%, n=70) axial defects (B). (C,D) Asymmetric spaw expression in LPM was normal in the majority of control YFP DNA-injected embryos (C), but was altered in many DN-Rock embryos (see Fig. 4D), and was often bilateral (red arrows in D). Expression of shh in the midline was intact in uninjected embryos (n=94/94), control YFP DNA-injected embryos (n=59/59) and DN-Rock DNA-injected embryos (n=89/91). (E-H) Whereas heart looping was normal in most control embryos (E,H), DN-Rock embryos showed an increased frequency (H) of reversed (F) or no heart looping (G). Embryos with axial defects were excluded for this analysis. |