
|
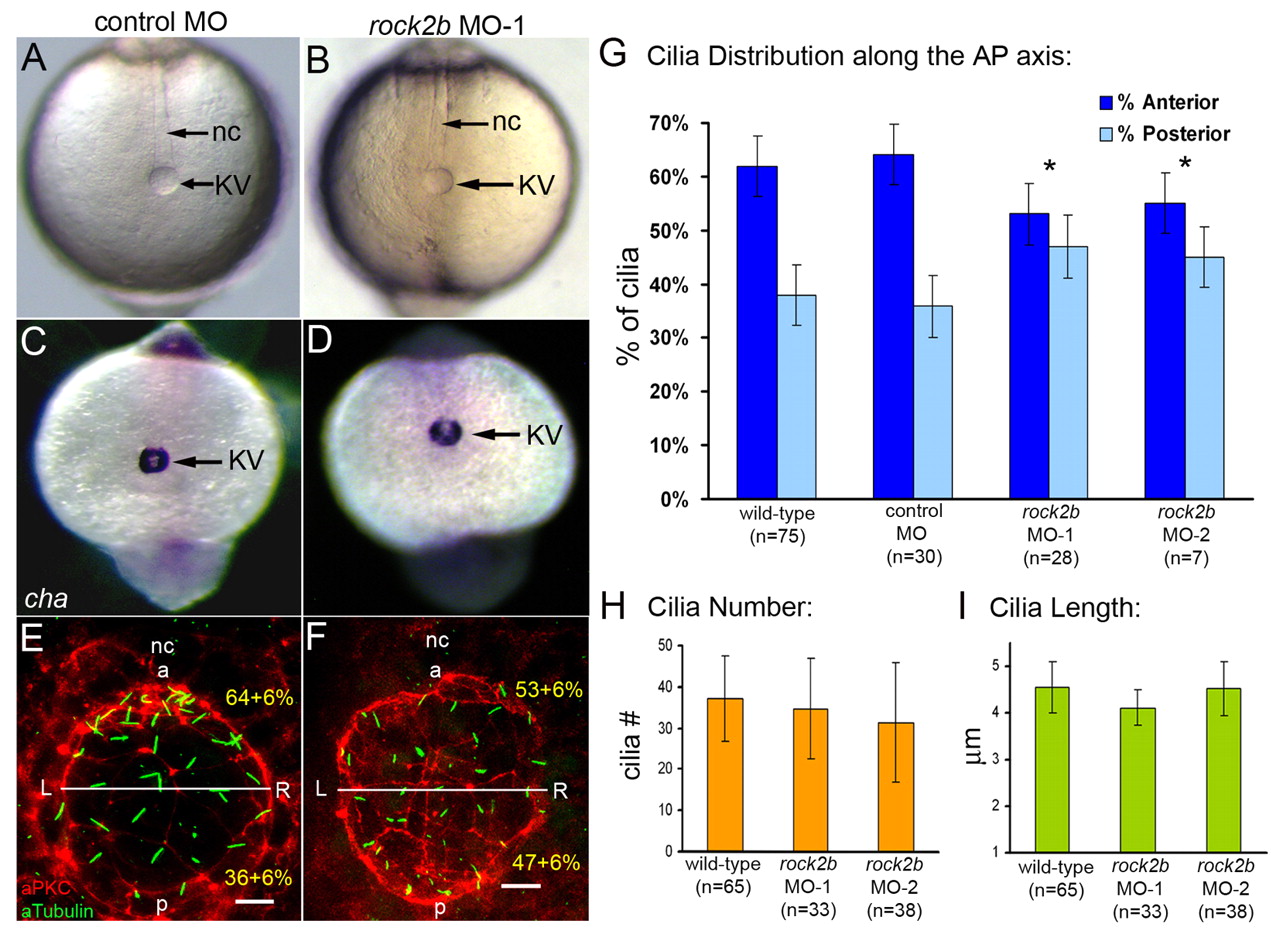
Fig. 5 rock2b knockdown disrupts AP asymmetric arrangement of KV cilia without inhibiting KV lumen formation or ciliogenesis. (A,B) Light micrographs at 8-SS show KV lumen (arrow) appeared similar in control MO (A) and rock2b MO (B) embryos. Surrounding tailbud tissue and nc also appeared similar. (C,D) Normal cha expression around KV (arrow) in control MO (C) and rock2b MO (D) embryos at 10- to 12-SS. (E,F) Fluorescent immunostaining of KV using aPKC and acetylated tubulin antibodies in control MO (E) and rock2b MO (F) embryos at 8-SS. KV was bisected into anterior and posterior regions using the position of the nc. (G) The average AP distribution ± 1 s.d. is shown (also shown in yellow in E and F). *The AP distribution of ciliated cells was significantly different (P<0.01) from controls. (H,I). There were no statistical differences (P>0.05) in cilia number or length among wild-type (37±10 cilia; 4.5±0.5 μm), rock2b MO-1 (34±12 cilia; 4.1±0.4 μm) and rock2b MO-2 (32±15 cilia; 4.5±0.6 μm) embryos. Scale bars: 10 μm. Error bars: 1 s.d. nc, notochord; a, anterior; p, posterior; L, left; R, right. n=number of embryos analyzed.