
|
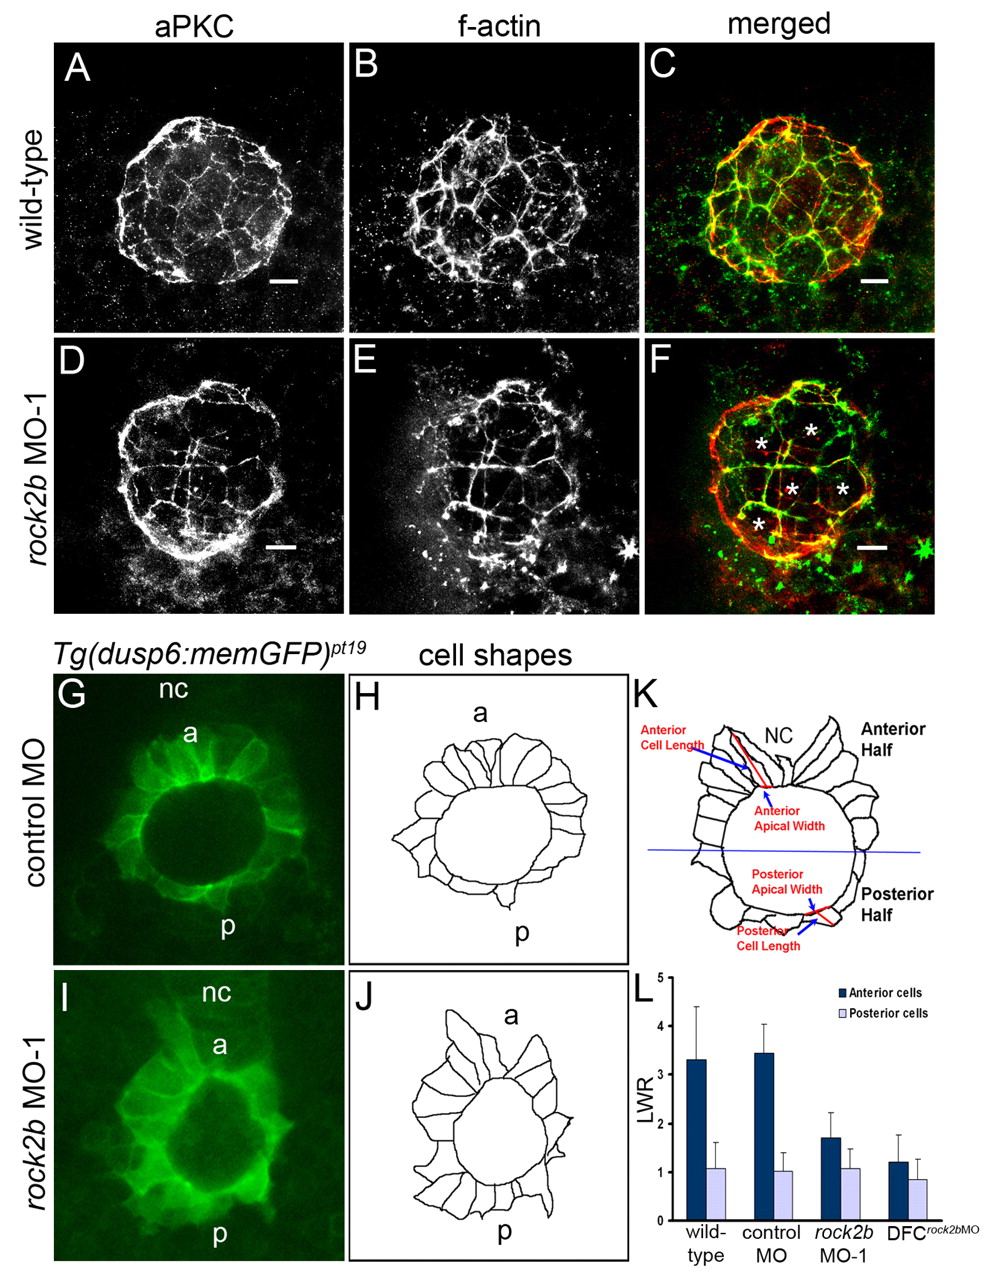
Fig. 7 rock2b knockdown alters KV cell shapes. (A-F) KV cells at 8-SS double fluorescently labeled with aPKC antibodies (A,D) and phalloidin (B,E) to detect apical membrane and filamentous actin (f-actin), respectively. Apical actin structures were present and co-localized with aPKC similarly in wild-type (A-C) and rock2b MO-1 (D-F) embryos, but the architecture of KV appeared different in rock2b MO-1 embryos, in which more KV cells had large apical surfaces (examples are marked by * in F). (G,I) Confocal images of memGFP-labeled KV cells in live Tg(dusp6:memGFP)pt19 transgenic embryos injected with control MO (G) or rock2b MO-1 (I). (H,J) Diagrams show KV cell shapes traced from confocal images. (K) Diagram of KV cells in a wild-type embryo, with a description of how the LWR was measured in anterior and posterior KV cells. (L) The average LWR for wild-type (n=12 embryos) control MO (n=5) and rock2b MO-1 (n=15) and DFCrock2b MO-1 (n=4) embryos. Scale bars: 10 μm. Error bars: 1 s.d. nc, notochord; a, anterior; p, posterior.