
- Title
-
Microtubule actin crosslinking factor 1 regulates the Balbiani body and animal-vegetal polarity of the zebrafish oocyte
- Authors
- Gupta, T., Marlow, F.L., Ferriola, D., Mackiewicz, K., Dapprich, J., Monos, D., and Mullins, M.C.
- Source
- Full text @ PLoS Genet.
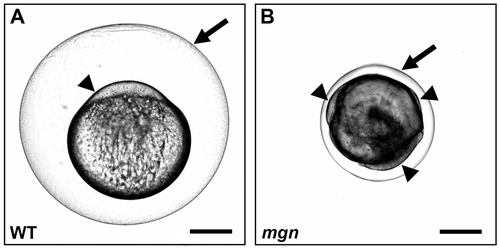
mgn is required for animal-vegetal polarity of the egg. Nomarski images of eggs from a wild-type (heterozygous sibling) female (A) and a mgn mutant female (B) one hour post activation. Eggs from mgn mutants exhibit cytoplasm surrounding the yolk (arrowheads) rather than restricted to the blastodisc at the animal pole as in wild-type (lateral view, animal pole up). In addition, mgn eggs are frequently smaller and display variable elevation of the chorion (arrow). Scale bar = 250 microns. PHENOTYPE:
|
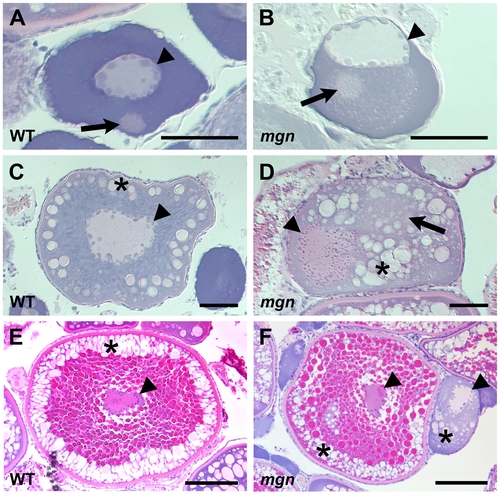
The mgn mutation causes defects during oogenesis. Sections of wild-type and mutant oocytes stained with hematoxylin (purple) and eosin (pink). The cytoplasm of stage I zebrafish oocytes is strongly basophilic, resulting in strong purple staining, while the mitochondria-rich Balbiani body is slightly acidophilic and stains pale pink with eosin. In wild-type mid stage I oocytes (A), the nucleus is localized at the center of the oocyte and the Balbiani body is near the future vegetal cortex. In mgn mutant stage I oocytes (B), the nucleus is asymmetrically localized and the Balbiani body, which frequently remains close to the nucleus, is surrounded by a region that is lightly stained with eosin. Wild-type stage II oocytes (C) have a central nucleus surrounded by cortical granules (CG). In stage II mgn mutant oocytes (D), the nucleus is mislocalized and CG accumulate opposite to the nucleus, in and around a faint eosin-stained area (arrow). During stage III, wild-type oocytes (E) accumulate yolk in the center of the oocyte and CG localize uniformly around the cortex, whereas stage III mgn mutant oocytes (F) display an uneven distribution of CG at the cortex. Also note stage II oocyte at right in (F). Arrowheads indicate oocyte nuclei; arrows indicate Balbiani body in (A,B); asterisks indicate CG. Scale bars = 50 microns (A,B), 100 microns (C,D), and 200 microns (E,F). |
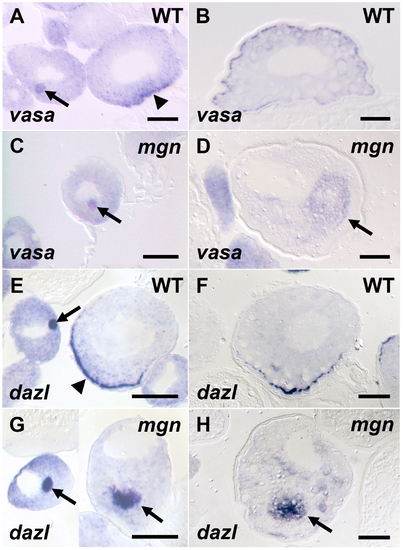
Germ plasm RNAs fail to localize to the cortex of mgn mutant oocytes. vasa (A–D) and dazl (E–H) in situ hybridization to wild-type and mgn mutant oocytes. vasa mRNA is found in the Balbiani body in early stage I wild-type (heterozygous) oocytes (A, arrow), transiently localizes to the vegetal cortex in late stage I (A, arrowhead) and then localizes all around the cortex during stage II (B). In mgn mutant oocytes, vasa mRNA is found in the Balbiani body in early stage I oocytes (C, arrow) and is then found ectopically localized to the middle of the oocyte during stage II (D, arrow). In early stage I wild-type oocytes, dazl mRNA is found in the Balbiani body (E, arrow) and then localizes to the vegetal cortex during late stage I (E, arrowhead) and stage II (F). dazl mRNA localizes to the Balbiani body of early stage I mgn mutant oocytes (G, left oocyte, arrow) and is found ectopically localized to the middle of the oocyte during late stage I and stage II (G, right oocyte and H, respectively, arrow). Scale bars = 50 microns. |
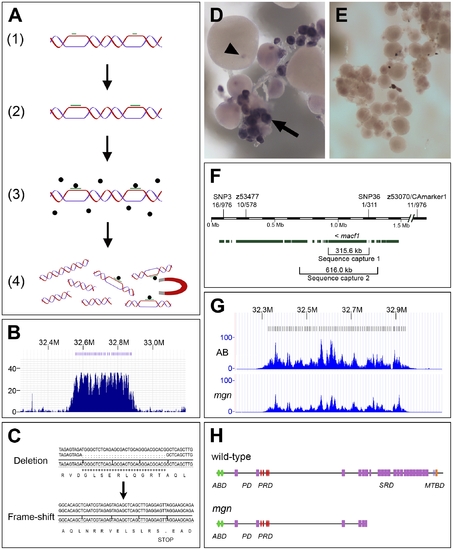
The molecular lesion in mgn mutants was identified by a combination of genomic sequence capture and massively parallel sequencing. (A) Schematic diagram depicting sequence capture method, which involves: 1) Hybridization of oligos (green bars) to long genomic DNA fragments at approximately 8 kb intervals; 2) Extension of oligos with biotinylated nucleotides; 3) Capture of targeted DNA with magnetic streptavidin-coated beads; 4) Extraction of captured DNA. (B) Histogram showing read depth for the 319.8 kb sequence capture region within a 0.9 Mb genomic interval. Increased read depth in the targeted region reflects the 243-fold average enrichment of the captured sequence (x-axis = chromosomal region containing targeted interval; y-axis = number of reads aligned to the region). Oligo binding positions are depicted as blue bars at the top of the figure. (C) 31 base pair deletion in macf1 in mgn mutants that results in a frame-shift and premature stop codon. Sequence at top shows the deletion from a heterozygous sibling; sequence at bottom shows the frame-shift in a homozygous mutant. (D–E) In situ hybridization of macf1 probe to wild-type (D) and mgn mutant (E) oocytes. macf1 is expressed in stage I wild-type oocytes (D, arrow) and is localized to a restricted domain during mid to late oogenesis (D, arrowhead). Levels of macf1 transcript are reduced in mgn mutant oocytes (E). (F) Genomic interval showing SSLP and SNP markers used for mapping, candidate genes, and sequence capture regions. macf1 is transcribed from the reverse strand. Hash marks indicate 0.5 Mb of sequence not shown. Annotation based on Ensembl Zv7/danRer5 with additional annotation information from Zv8/danRer6. (G) Histograms showing read depth for the 616 kb sequence capture region within a 0.9 Mb interval. The increased read depth within the targeted region reflects the 72- and 43-fold enrichment of captured sequence from the AB and mgn mutant (TU) genomic DNA, respectively. Oligo binding positions are depicted as bars at the top of the figure. (H) Predicted protein structure of zebrafish Macf1 (Pfam database) and expected truncation in the spectraplakin domain. Actin binding domain (ABD), Plakin domain (PD), Plakin repeat domain (PRD), Spectraplakin repeat domain (SRD), Microtubule binding domain (MTBD). Green = Calponin homology domain; purple = Spectrin domain; red = plakin domain; blue = EF hand domain; orange = GAS2 domain. |
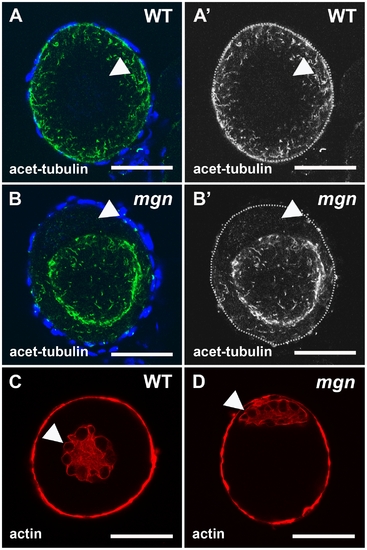
Localization of stable microtubules but not actin is disrupted in mgn mutant oocytes. Stage I oocytes stained with an antibody to acetylated tubulin to label stable microtubules (A,B) or rhodamine phalloidin to label actin cytoskeleton (C,D). In wild-type stage I oocytes, acetylated microtubules are uniformly distributed throughout the oocyte (A,A′), whereas in mgn mutant oocytes, acetylated microtubules are largely absent from peripheral regions of the oocyte (B,B′). DAPI staining around oocytes labels nuclei of surrounding somatic follicle cells. Green = acetyated tubulin; blue = DAPI. In both wild-type (C) and mgn mutant oocytes (D), actin is localized to the nucleus and at the cortex. Arrowheads indicate oocyte nuclei. Red = phalloidin. Scale bars = 25 microns. All images are single optical sections. |

mgn mutant oocytes exhibit an enlarged Balbiani body and absence of mitochondria and ER from the periphery of the oocyte. Oocytes stained with DiOC6 to label ER and mitochondria (A–E). In a wild-type mid stage I oocyte, the nucleus is in the middle of the oocyte (arrowhead) and the Balbiani body is at the future vegetal side of the oocyte (A, arrow). (B,C) Mutant oocytes exhibit an enlarged Balbiani body (arrows), and an absence of ER, mitochondria and the Balbiani body from the periphery. Images are single optical sections. In stage II wild-type oocytes (D), ER and mitochondria are localized throughout the oocyte, whereas in mgn mutant oocytes (E), ER and mitochondria are concentrated in the middle of the oocyte and are absent from peripheral regions. Images are single optical sections of 0.5 micron oocyte sections. (F) Bar graph depicting size of Balbiani body (Bb) during stage I of oogenesis. 50–70 micron oocytes, n = 10 wild-type and 10 mutant oocytes; 70–90 micron oocytes, n = 15 wild-type and 15 mutant oocytes; 90–110 micron oocytes, n = 15 wild-type and 15 mutant oocytes. Arrowheads indicate nuclei. (A–C) scale bars = 25 microns. (D,E) scale bars = 100 microns. |
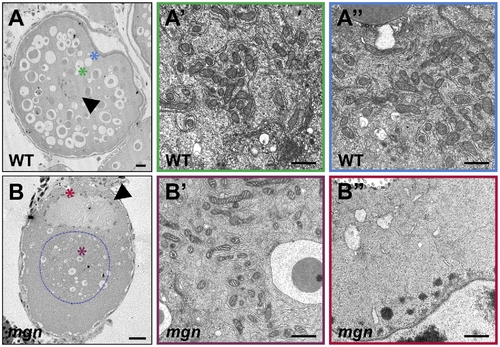
ER and mitochondria are absent from the periphery of stage II mgn mutant oocytes. Transmission electron micrographs of stage II wild-type (A–A″) and mgn mutant (B–B″) oocytes. ER and mitochondria are distributed throughout wild-type stage II oocytes (A–A″) but are absent from the periphery of stage II mgn mutant oocytes (B–B″). Arrowheads indicate oocyte nuclei. Positions of regions shown at high magnification (A′, A″, B′ and B″) are indicated by the respective colored asterisks in A and B. Dashed blue line outlines the electron dense region in which most of the ER and mitochondria are located. Scale bars = 20 microns (A, B) and 1 microns (A′, A″, B′ and B″). PHENOTYPE:
|